
|
Fig. 5
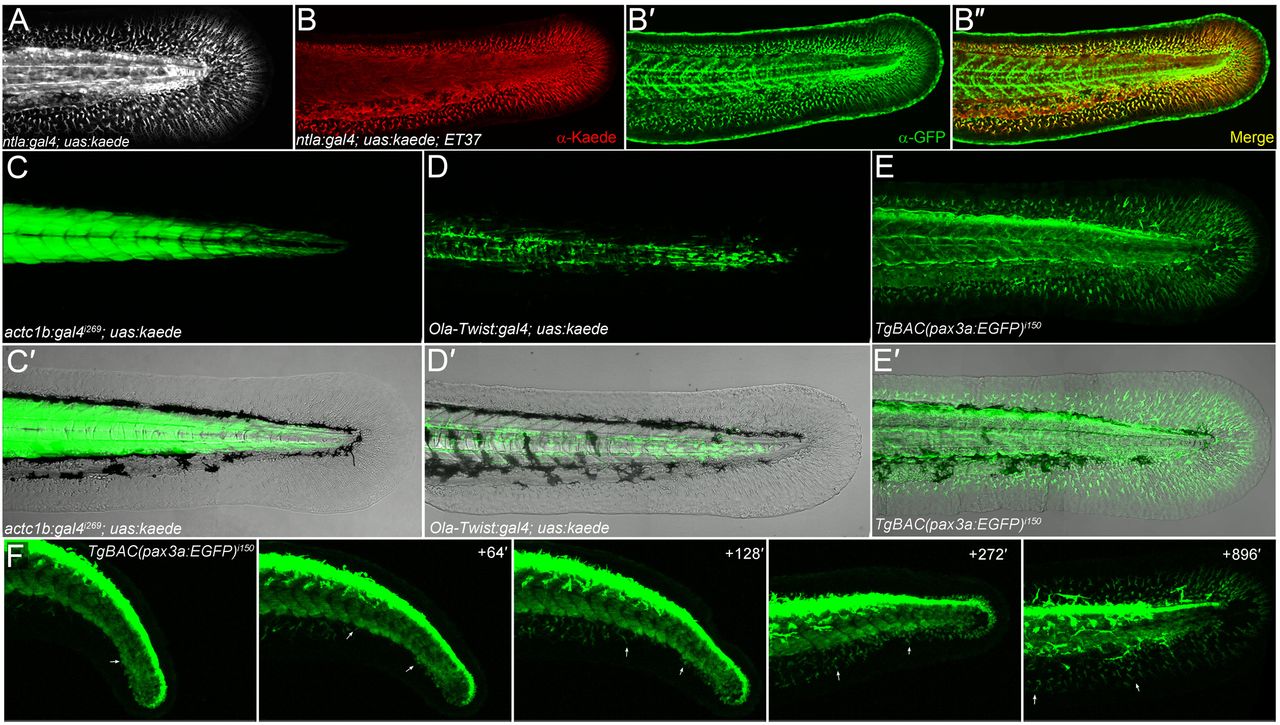
All fin mesenchyme cells derive from paraxial mesoderm. (A) Confocal image of the tail region of a 48-hpf ntla:gal4; uas:kaede embryo. (B-B2) Immunofluorescent staining of 48-hpf ntla:gal4; uas:kaede; ET37 triple transgenic embryo showing total overlap (B2) of Kaede signal (red, B,B2) and eGFP (green, B2,B2) in the fin. (C-E2) Fluorescent images alone (C,D,E) and superimposed on Nomarski images (C2,D2,E2) of the trunk/tail of 48-hpf embryos. The myotome (C,C2), sclerotome (D,D2) and dermomyotome (E,E2) are labelled by actc1b:Gal4i269; uas:kaede (C,C2), Ola-Twist:Gal4; uas:kaede (D,D2) and TgBAC(pax3a:EGFP)i150 (E,E2) transgenics, respectively. (F) Stills taken from time-lapse Movie 4 (see supplementary material Movie 4) of the tail region of a TgBAC(pax3a:EGFP)i150 embryo at 24 hpf (left panel) with subsequent time points at given intervals (in minutes) in the panels to the right. Two fin mesenchyme cells can be tracked (arrows) from the dermomyotome into the fins. Note that eGFP expression is higher in neural crest and dorsal neural tube than in dermomyotome.