
|
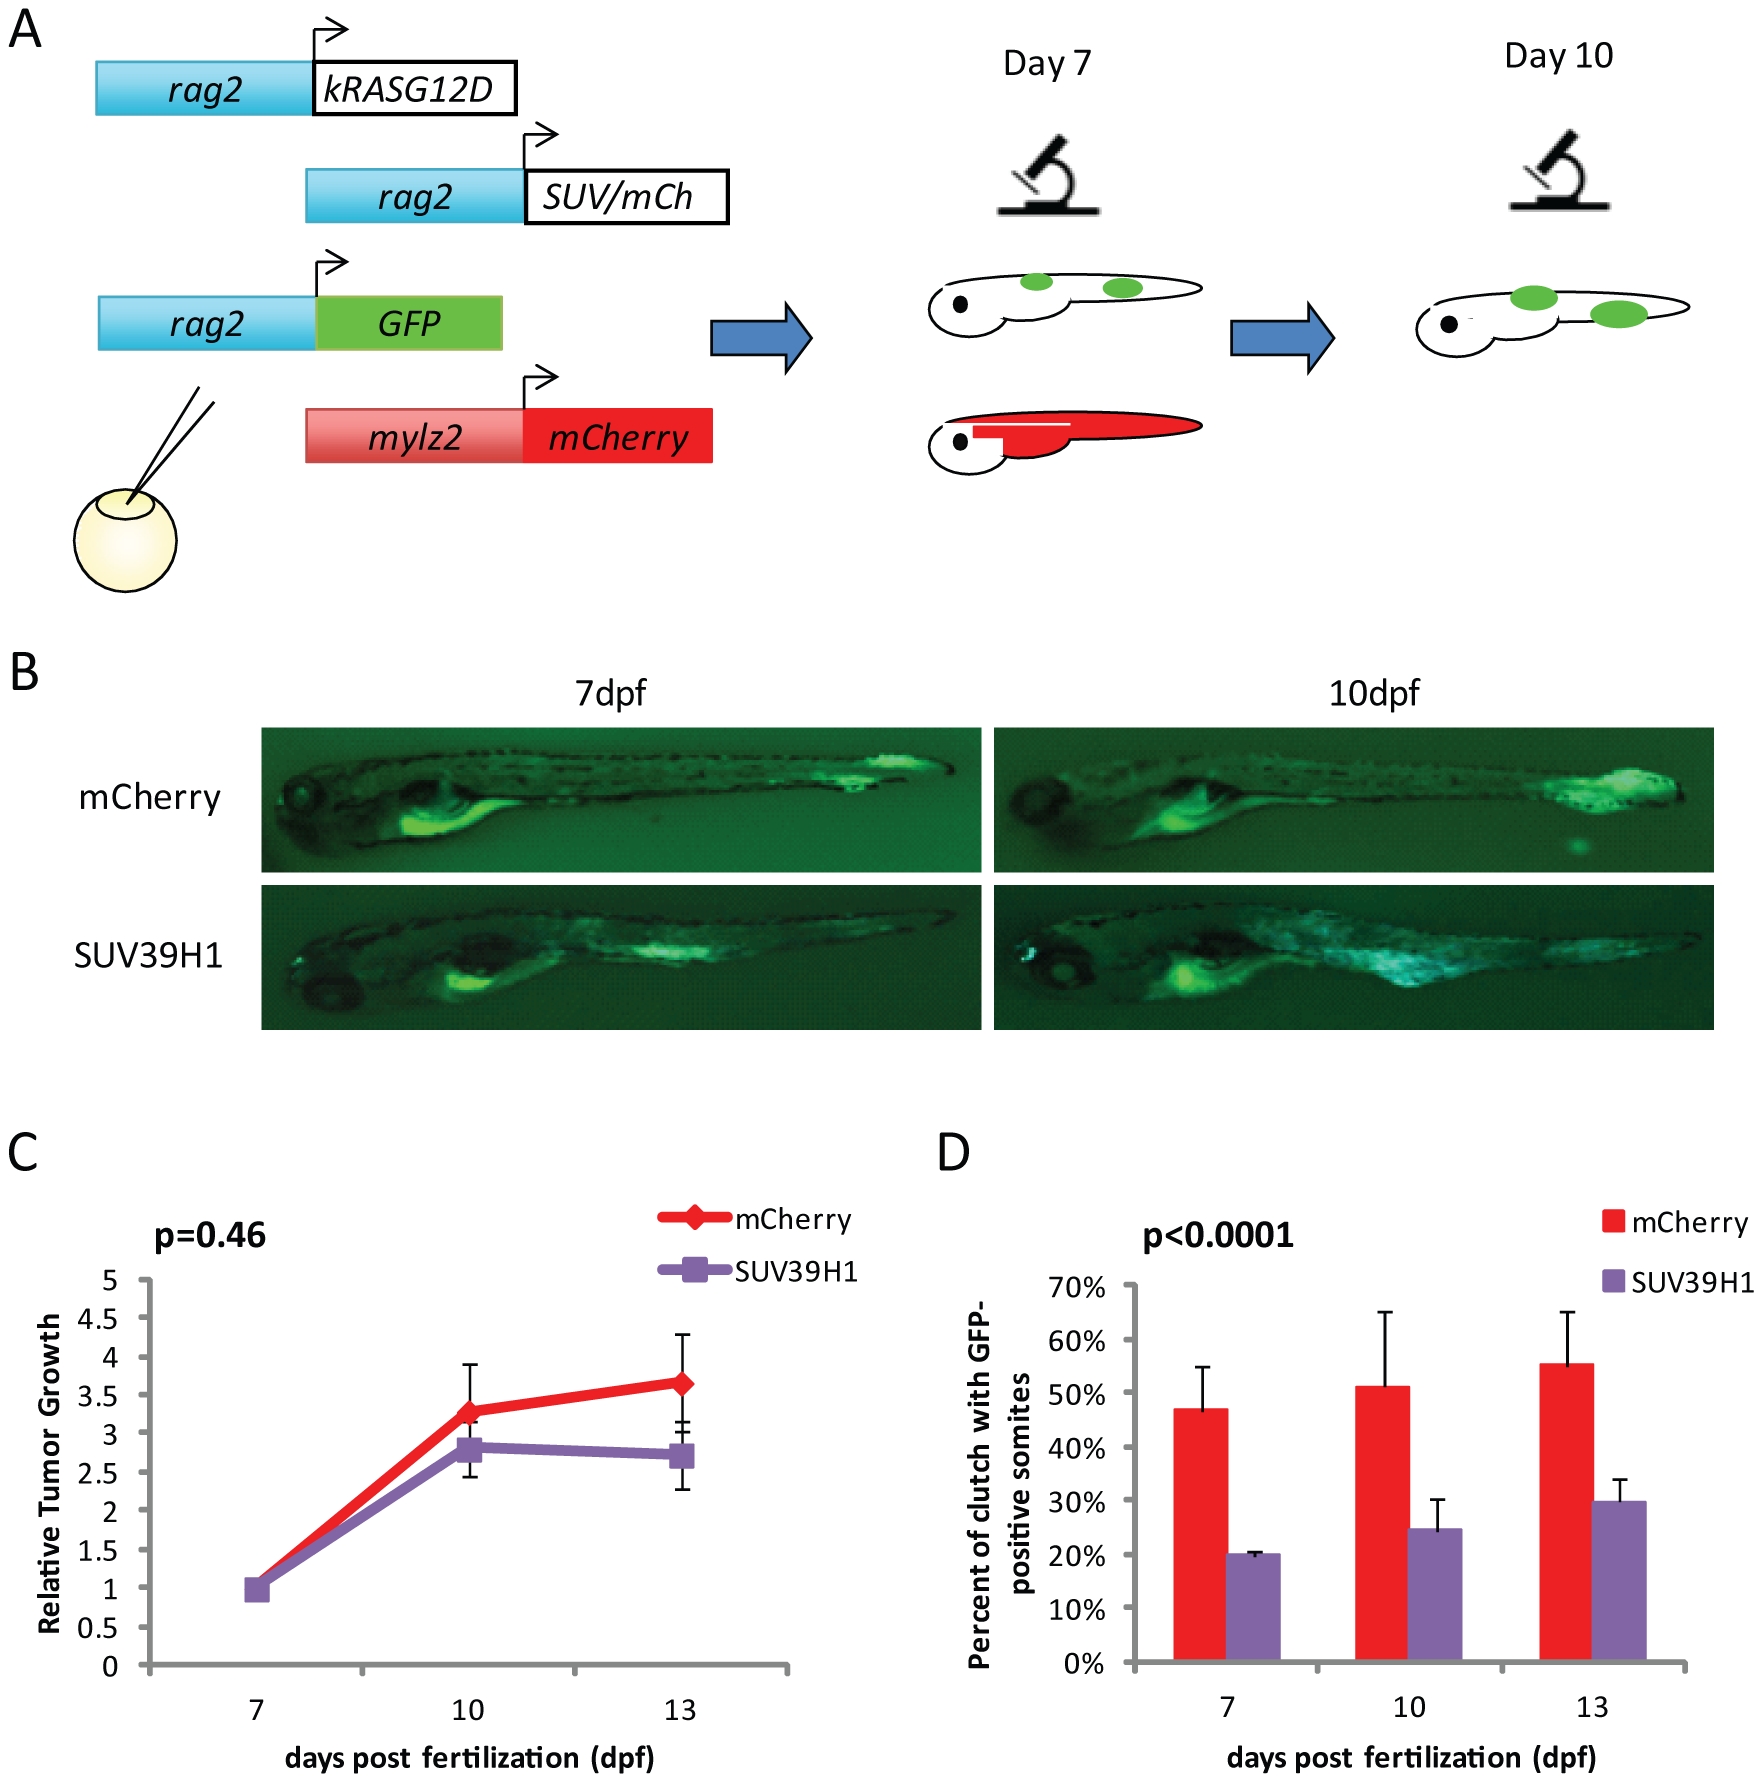
Fig. 4
SUV39H1 impacts the initiation, not the growth rate, of the tumors.
(A) Experimental design to view the tumors in larval stages by fluorescence. Four constructs are injected into one cell stage embryos, rag2-hKRASG12D, rag2-hSUV39H1 or control rag2-mCherry, rag2-GFP, and mylz2-mCherry. Fish highly mosaicism for mylz2-mCherry expression are analyzed on day 7 for presence of GFP, indicative of developing tumors. Analysis is also performed on day 10 to note tumor growth. (B) Representative images of 7 and 10 dpf larvae with GFP-positive cells in the musculature. There is visible growth between 7 and 10 dpf as they develop into tumors. (C) Tumor growth rates, relative to size of tumor on day 7. There is no significant difference between growth rates of the SUV39H1-overexpressing tumors compared to control tumors (SUV39H1 n = 22, mCherry n = 13, p = 0.46). (D) Percentage of larvae within a clutch that contain GFP-positive cells in the musculature. More fish in the mCherry clutches have developing tumors when compared to SUV39H1 clutches (SUV39H1 n = 200, mCherry n = 136, p<0.0001).