
|
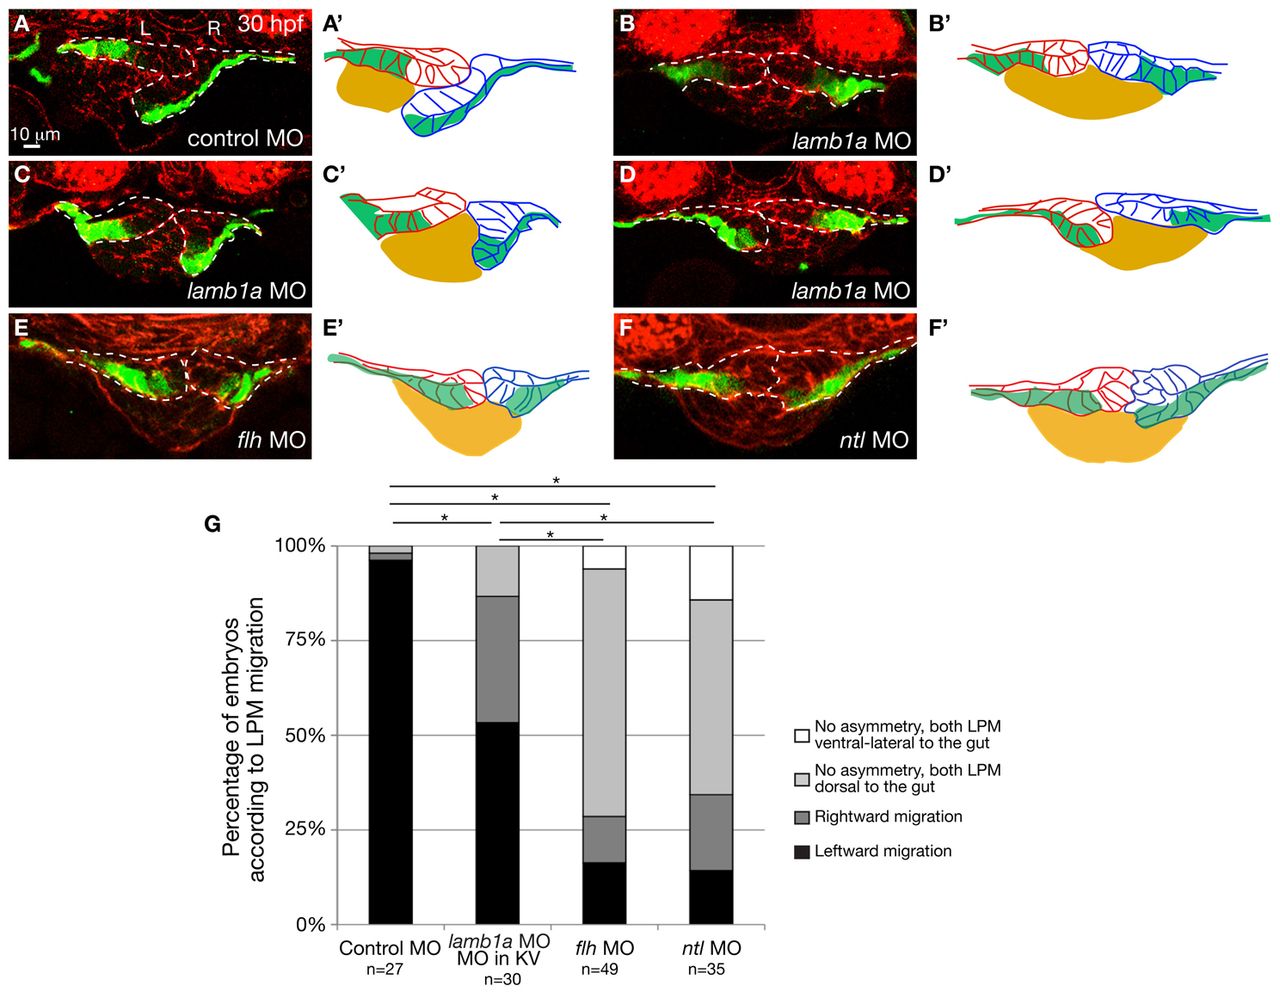
Fig. 6 lamb1a knock-down in the KV as well as global knock-down of flh and ntl randomized the direction of LPM migration without altering epithelial polarity or composition of the LPM. (A-F) Expression of Tg(hand2:EGFP) in the LPM of embryos injected with control (A) or lamb1a (B-D) MO into the KV at 3 hpf, or flh MO (E) or ntl MO (F) at the one-cell stage. Transverse sections, dorsal towards the top. Scale bar: 10 μm. Dashed lines outline the LPM. L, left; R, right. (A′-F′) The LPM and gut shown in A-D. Gut (yellow), left LPM (red), right LPM (blue), Tg(hand2:EGFP)-expressing cells (green). (G) Proportions of control, lamb1a, flh and ntl MO-injected embryos exhibiting different directions of LPM migration. Effect of lamb1a knockdown in the KV on LPM migration is statistically significant, when compared with control, flh and ntl morphants (*P<0.001). The distribution of LPM migration phenotype is similar in flh and ntl morphants (P=0.794), but significantly different in embryos injected with lamb1a MO in the KV or with the control MO.