
|
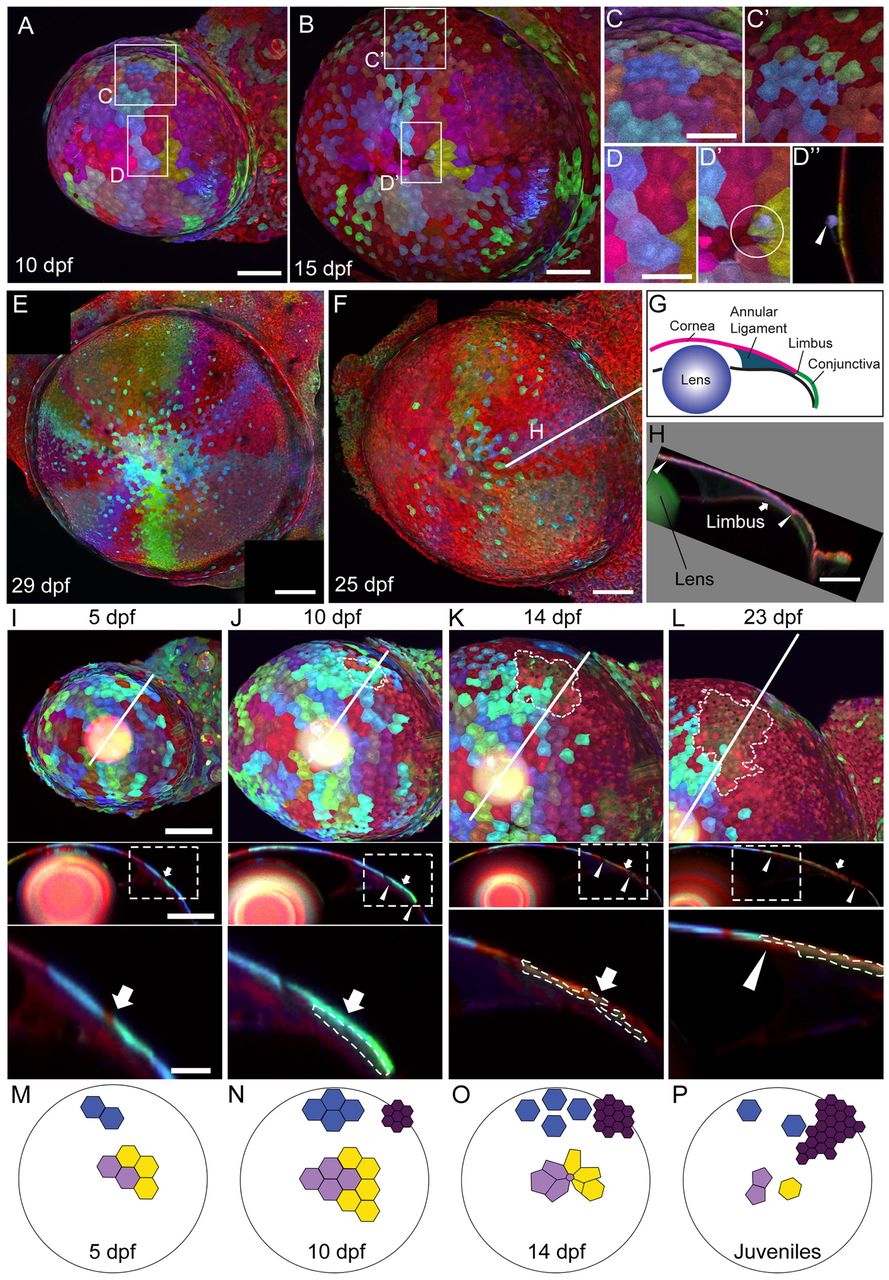
Fig. 7 Long-term clonal analyses in the cornea. (A,B) Corneal clones at 10 and 15 dpf. (C,C2) Peripheral cornea clones become scattered and interspersed by smaller cells. (D-D′′) Rosette-like structures are seen in the central cornea (compare D with D′, circle marks a rosette). In optical cross-section at the center of the rosette (D2), a cell that has been extruded from the corneal surface can be seen (arrowhead). (E,F) Two examples of wedge-shaped clones in juvenile stage fish. (G) The anterior segment of the eye, shown in cross-section. The limbus marks the boundary of the cornea (pink) and the conjunctiva (green). (H) Optical cross-section at the plane indicated by the white line in F. Arrowheads indicate the peripheral and central boundaries of the clone. Arrow marks the limbus. (I-L) Top panels show lateral view of the cornea, with an olive-colored, late-born clone outlined (clone is not found at 5 dpf). Part of the olive-colored clone is underneath cyan-colored cells, which become more dispersed over time. Middle panels show optical cross-sections at the plane indicated by the white line in the top panels. Bottom panels show the region outlined in the box in the middle panels. The olive-colored clone is outlined. Arrows indicate the limbus; arrowheads mark the peripheral and central boundaries of the clone. (M-P) Model of clone development in the corneal epithelium. Large circle indicates the cornea and small polygons indicate cells. (M) At 5 dpf, clones are small and cohesive. (N) At 10 dpf, cells proliferate and remain cohesive. Small clones at the limbus region are formed (dark purple cluster). (O) At 14 dpf, early formed clones are scattered in the peripheral cornea (blue cluster) and form rosettes in the central cornea (light purple and yellow clusters). Cells in the late-formed purple cluster proliferate and migrate towards the center. (P) Early-formed clusters are further dispersed. Late-formed clusters begin to form wedge-shape structures. Scale bars: 100 μm in A,B; 50 μm in C,D; 200 μm in E,F,H; in I-L, 100 μm in the top and middle panels, and 25 μm in the bottom panels.