
|
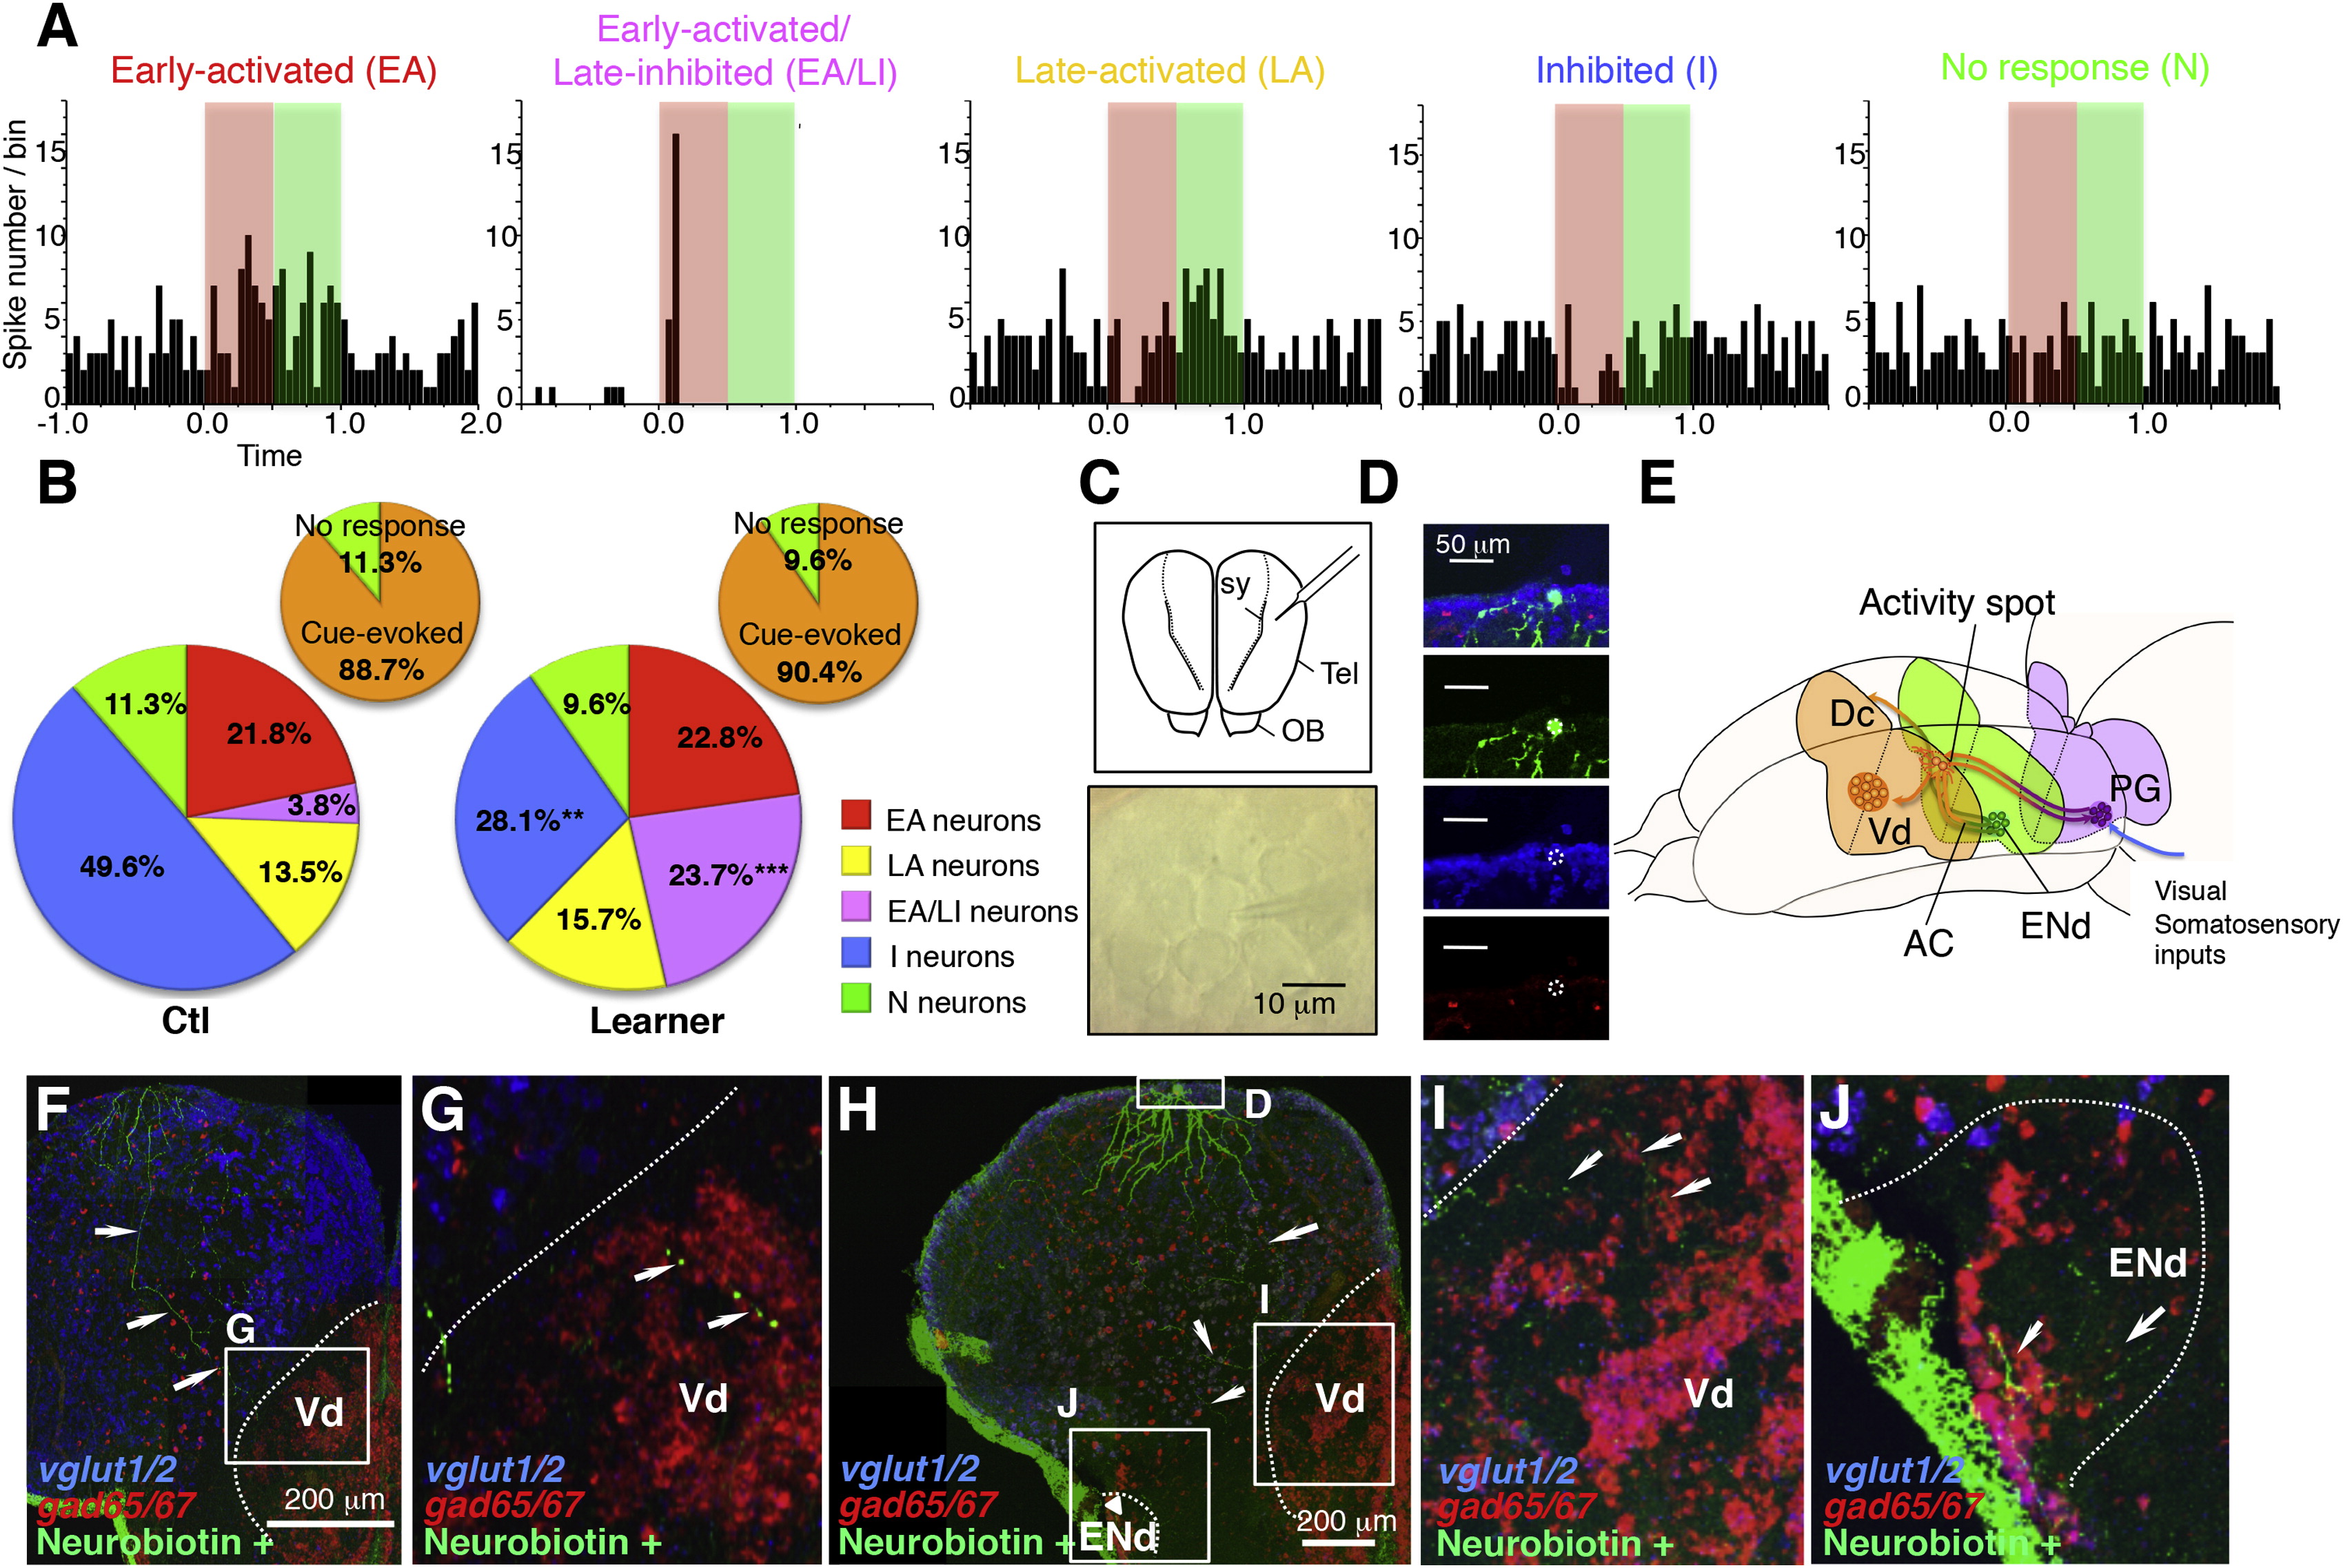
Fig. 4 Electrophysiological, Morphological, and Neurochemical Profiling (A) Representative neural activity for each response class of neuron. A red shadow indicates the 500 ms cue presentation period. A green shadow indicates the following 500 ms postcue presentation period used for the analysis. (B) Learning-dependent changes in the proportion of each type of neurons. The proportion of EA/LI neurons was significantly larger in learner fish (p < 0.001***, χ2 test). The proportion of I neurons was significantly smaller in learner fish (p < 0.01**, χ2 test). EA neurons, ctl, n = 30, learner, n = 26; EA/LI neurons, ctl, n = 5, learner, n = 15; LA neurons, ctl, n = 18, learner, n = 18; I neurons, ctl, n = 65, learner, n = 32; N neurons, ctl, n = 15, learner, n = 11. (C) The recording site was lateral to sy and within the activated area (see Experimental Procedures). Tel, telencephalon; OB, olfactory bulb. Scale bar indicates 10 μm. (D) Cell body of neuron in (G) (the square region indicated as D) showing expression of vglut 1,2.1, 2.2 (blue) but not gad 65,67 (red). Scale bar indicates 50 μm. (E) Schematic diagram showing the connection of the activated area in the dorsal telencephalon with other parts of the brain based on single-cell tracing studies and bulk labeling. The activity spot receives the visual and/or somatosensory inputs from the PG. It projects to the Vd, the presumptive striatum in teleosts, and also toward the contralateral hemisphere passing by the ENd and extending into the AC. There are reciprocal projections between the activated area and the ENd as well as the PG, indicated by bidirectional arrows. See Supplemental Information for details of the tracing study. Anterior is to the left. Dorsal is toward the top. (F) An example of a labeled neuron (green) projecting to the dorsal nucleus of the ventral telencephalic area (Vd). Arrows show the trajectory of the projecting axon-like structure. The cell body was inadvertently removed during histochemistry processing. Scale bar indicates 200 μm. (G) Magnified view of the square region in (F) (indicated as G) showing the extended projection within the Vd. vglut 1,2.1, 2.2 (blue) and gad 65,67 (red) were costained by in situ hybridization. Arrows show the terminated axon-like projection within the Vd (outlined with a white dotted line). (H) Example of a labeled neuron (green) projecting toward the entopeduncular nucleus dorsal part (ENd) as well as the Vd. Arrows indicate the putative axonal projection and an arrowhead indicates the extended projection within the ENd. vglut 1,2.1,2.2 (blue) and gad 65,67 (red) were costained by in situ hybridization. Scale bar indicates 200 μm. (I) Higher magnification of the square region in (H) (indicated as I) around the Vd. The arrows show the bifurcated axon branches entering the Vd region. A white dotted line outlines the Vd. (J) Higher magnification of the square region in (I) (indicated as J) around the ENd. The arrows show the passing by axonal projection. A white dotted line outlines the ENd. See also Figure S4.