
|
Fig. S4
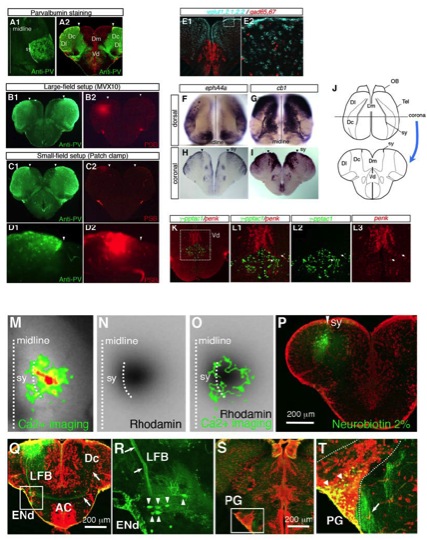
(A-D) The activated areas observed in the large-field and the small-field imaging setups coincide.
(A1, A2) Parvalbumin (PV) immunohistochemistry of wild-type fish. Dorsal view (A1) and coronal section (A2). Dotted line in (A1) and arrowheads in (A2) indicate the sy. Strong staining of PV was observed in the soma, in a very restricted area of the dorsal telencephalon lateral to sy, encompassing Dc and Dl.
(B1, B2) Labeling of the activated area by pontamine sky blue (PSB) in the large-field imaging setup, with co-staining of PV. PSB was injected into the activated area identified by calcium imaging (See Experimental Procedure). The PSB staining was found lateral to sy (arrowheads) within a strong PV-expressing area.
(C1, C2) Labeling of the activated area by PSB in the small-field imaging setup was found in the same area as labeling in the large-field setup, lateral to sy (arrow heads) within a strong PV-expressing area.
(D1, D2) Magnified view near the injection site of PSB in E and F. PSB staining is restricted within a strong PV-expressing area lateral to sy (arrowheads).
(E-L)Zebrafish telencephalon expresses genes that are expressed in the mammalian cortex and striatum.
(E1, E2) Expression of vglut1,2.1,2.2 (blue) and gad65,67 (red) was analyzed by two-color fluorescent in situ hybridization in zebrafish telencephalon. E2 shows a close-up view of the square region in E1. Note that neurons in the dorsal telencephalic area are mainly glutamatergic (E1), although there were also some dispersed neurons expressing gad65/67 (E2). In contrast, neurons in the ventral telencephalon are mainly GABAergic, showing strong gad65/67 expression (E1).
(F-I) Expression of ephA4a and cannabinoid receptor 1 (cb1) was analyzed by in situ hybridization in zebrafish telencephalon, examined at dorsal (F, G) and coronal (H, I) views. For the dorsal view, a 400-μm thick horizontal section of the dorsal-most telencephalon was processed for in situ hybridization. Straight and curved dotted black lines in F and G indicate the midline between two telencephalic hemispheres and the sulcus ypsilonformis (sy),respectively. Black arrowheads in H and I indicate the position of sy.
In zebrafish telencephalon, ephA4a, the zebrafish homolog for EphA4, is expressed in Dc and Dl (F, G). The border of ephA4a expression corresponds to the border between Dc and Dm, which is morphologically discernible by the sy fissure. Dm is devoid of ephA4a expression. In contrast, cb1, the zebrafish homolog for Cannabinoid receptor 1 (CB1) is expressed strongly in Dm and less in Dc and Dl (H, I). Again, the border of cb1 expression corresponds to sy. These expression patterns are consistent with the fact that mouse CB1 is expressed in the basolateral amygdala (Marsicano and Lutz, 1999; Katona et al., 2001; Marsicano et al., 2002) and mouse EphA4 is expressed in the cortical layer III/IV and the hippocampus (Greferath et al., 2002). (J) Schematic dorsal and coronal views of zebrafish telencephalon. OB, olfactory bulb; Tel, telencephalon; Dm, medial zone of the dorsal telencephalic area; Dc, central zone of the dorsal telencephalic area; Dl, lateral zone of the dorsal telencephalic area; Vd, dorsal nucleus of the ventral telencephalic area. (K-L) Expression of <γ-pptac1 (green) and penk (red) was analyzed by two-color fluorescent in situ hybridization in zebrafish telencephalon. Coronal view is shown. Magnified views of the square region in K are shown in L1-L3. Note that neurons expressing γ-pptac1 and penk are mostly separate in the Vd as in the mammalian striatum except for the rare (two) double-positive cells (L1-L3, white arrows).
(M-T) Tracing afferent and efferent connections of the activated area. (M-O) The activity spot was detected by large-field calcium imaging (M). The straight dotted line indicates the midline between two hemispheres. The curved dotted line indicates sy. The tracer-injected site was confirmed by the rhodamine fluorescence (N) overlapping with the activity spot (O).
(P) Coronal section at the injection site, located lateral to sy (arrowhead). Scale bar indicates 200 μm.
(Q, R) Anterograde tracing of the activity spot revealed that axons from the activity spot formed a lateral forebrain bundle (LFB, arrows in R) and passed by the ENd. Retrogradely labeled large cell bodies within the ENd were also observed (arrowheads in R). After passing by the ENd, the projection extended into the anterior commissure (AC), reaching the contralateral hemisphere (arrows in Q). Scale bar in Q indicates 200 μm.
(S, T) Retrogradely labeled cell bodies (arrowheads in T) were observed in the midbrain multisensory relay nucleus, the preglomerular nucleus (PG, dotted line). There were also some fibers located medially to the PG (an arrow in T). Scale bar in S indicates 200 μm.