
|
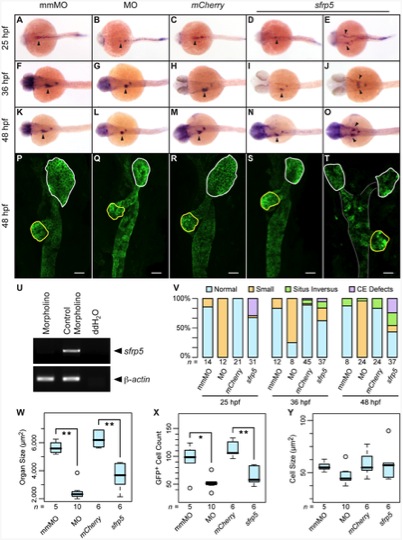
Fig. 5 Sfrp5 regulates hepatoblast formation in zebrafish.
Embryos were injected with 0.5 pmol morpholino against sfrp5 (MO; B, G, L, Q), 0.5 pmol of the control morpholino (mmMO; A, F, K, P), 100 pg mCherry mRNA (C, H, M, R), or 100 pg sfrp5 mRNA (D, E, I, J, N, O, S, T). A–O) Whole-mount in situ hybridization with a probe against hhex staining embryos at 25 hpf (A–E), 36 hpf (F–J), and 48 hpf (K–O). Dorsal view, anterior to the left. Arrowheads point to the hepatoblast. P–T) Confocal microscopy of injected gutGFP embryos. Ventral view with anterior to top. Liver is outlined in white, pancreas in yellow. The scale bar is equal to 25 μm. U) RT-PCR of morpholino and control injected embryos with primer pairs detecting sfrp5 or β-actin. V) Bar chart representing distribution of normal and abnormal embryos processed by in situ hybridization, with representative samples shown in A–O. W) Boxplot showing liver size distribution in injected embryos. **: p<0.001. X) Boxplot showing distribution of the number of GFP+ liver cells. *: p<0.05, **: p<0.01. Y) Boxplot showing liver cell size distribution. Numbers below each column or boxplot show how many embryos were analyzed.