
|
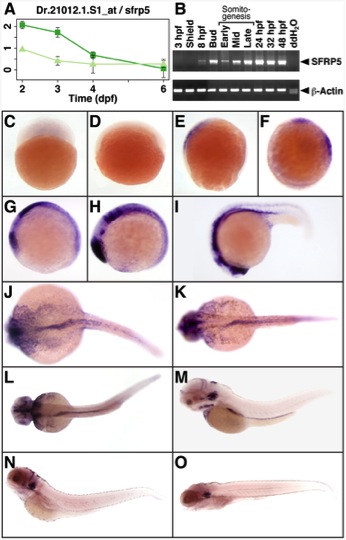
Fig. 1 Expression profile of sfrp5. Expression level of sfrp5 as measured by probeset Dr.21012.1.S1 in GI tissue (dark green squares) and non-GI tissue (light green triangles) from 2 through 6 dpf (for details, see [39]). B) Expression of sfrp5 and β-actin by RT-PCR of total RNA isolated at indicated time points. C–O) Whole-mount in situ hybridization showing sfrp5 expression in zebrafish embryos at 3 hpf (C), shield stage (D), 8 hpf (E), bud stage (F), early (G), mid (H), and late somitogenesis (I), 24 hpf (J), 32 hpf (K), 2 dpf (L), 3 dpf (M), 4 dpf (N), and 6 dpf (O). Lateral views with animal pole to the top (C–F) or with anterior to the left (G–I, M–O). Dorsal view with anterior to the left (J–L).