
|
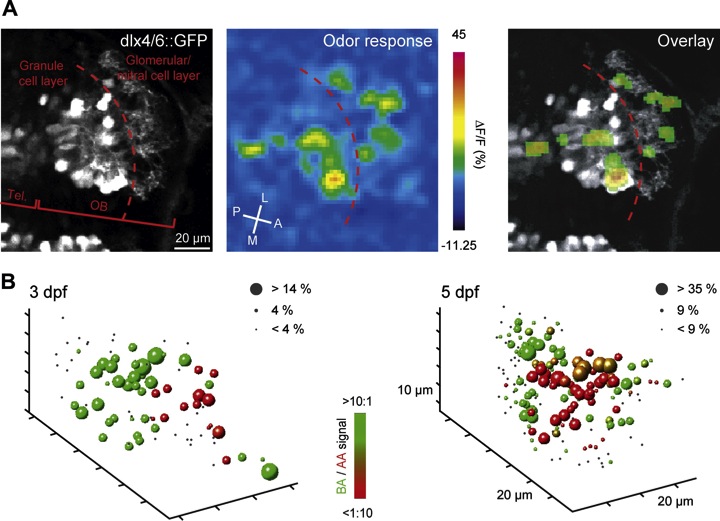
Fig. 3 (A) Multiphoton calcium imaging of odor-evoked activity patterns in the developing OB. Left: optical section through the OB of a transgenic zebrafish expressing GFP under the control of dlx4/6 enhancer elements, which target expression to subsets of interneurons. Center: changes in fluorescence intensity of a red-fluorescent calcium indicator (rhod-2-AM) in the same field of view evoked by odor stimulation (nucleotide mix). Right: thresholded overlay. (B) Three-dimensional reconstruction of calcium signal patterns in larvae at 3 and 5 dpf. Red: responses to amino acid mix (AA); green: responses to bile acid mix (BA); yellow: responses to both stimuli. Size of spheres indicates response magnitude. Responses to amino acids and bile acids are spatially segregated already at 3 dpf. Reproduced from (Li et al., 2005).
Reprinted from Mechanisms of Development, 130(6-8), Miyasaka, N., Wanner, A.A., Li, J., Mack-Bucher, J., Genoud, C., Yoshihara, Y., and Friedrich, R.W., Functional development of the olfactory system in zebrafish, 336-46, Copyright (2013) with permission from Elsevier. Full text @ Mech. Dev.