
|
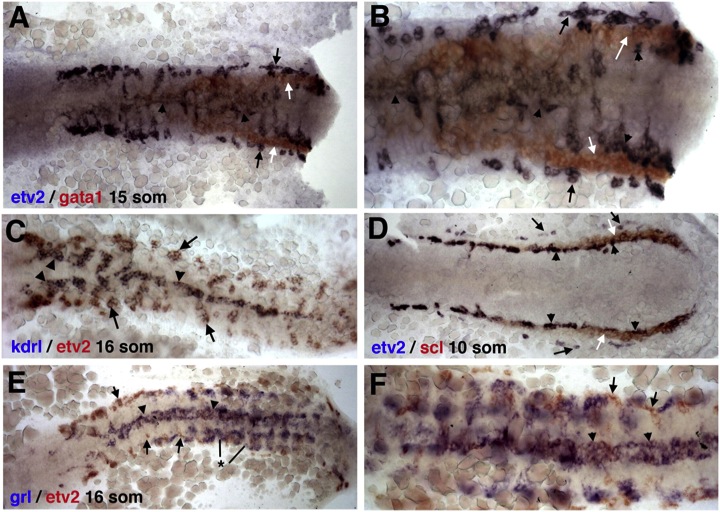
Fig. 2 Two-Color ISH Expression Analysis of etv2 and Other Endothelial and Hematopoietic Markers ISH expression of (A and B) etv2 and gata1 at the 15-somite stage, (C) etv2 and kdrl at the 16-somite stage, (D) etv2 and scl at the 10-somite stage, and (E and F) etv2 and grl at the 16-somite stage. (A and B) Erythroid-specific gata1 expression (white arrows) is positioned between the medial (arrowheads) and lateral (black arrows) etv2-expressing angioblasts; (B) higher magnification view. (C) etv2 and kdrl expression overlaps at the midline (arrowhead) in the medial angioblasts. While strong etv2 expression is seen in the lateral angioblasts (arrow), no or very little lateral kdrl expression is observed. (D) Relative to vascular endothelial progenitor cells, erythroid-specific scl expression (white arrows) is positioned between the medial (arrowheads) and lateral (black arrows) etv2-expressing angioblasts. (E and F) Similar to (C), grl expression overlaps with etv2 expression in medial angioblasts at the midline (arrowheads). Lateral angioblasts are grl-negative (arrows). Note that the strong bilateral grl expression (*) does not correspond to endothelial cells and is within the somitic tissue as reported previously (Zhong et al., 2000). See also Movies S1, S2, S3, and S4.
Reprinted from Developmental Cell, 25(2), Kohli, V., Schumacher, J.A., Desai, S.P., Rehn, K., and Sumanas, S., Arterial and venous progenitors of the major axial vessels originate at distinct locations, 196-206, Copyright (2013) with permission from Elsevier. Full text @ Dev. Cell