
Image
|
Figure Caption
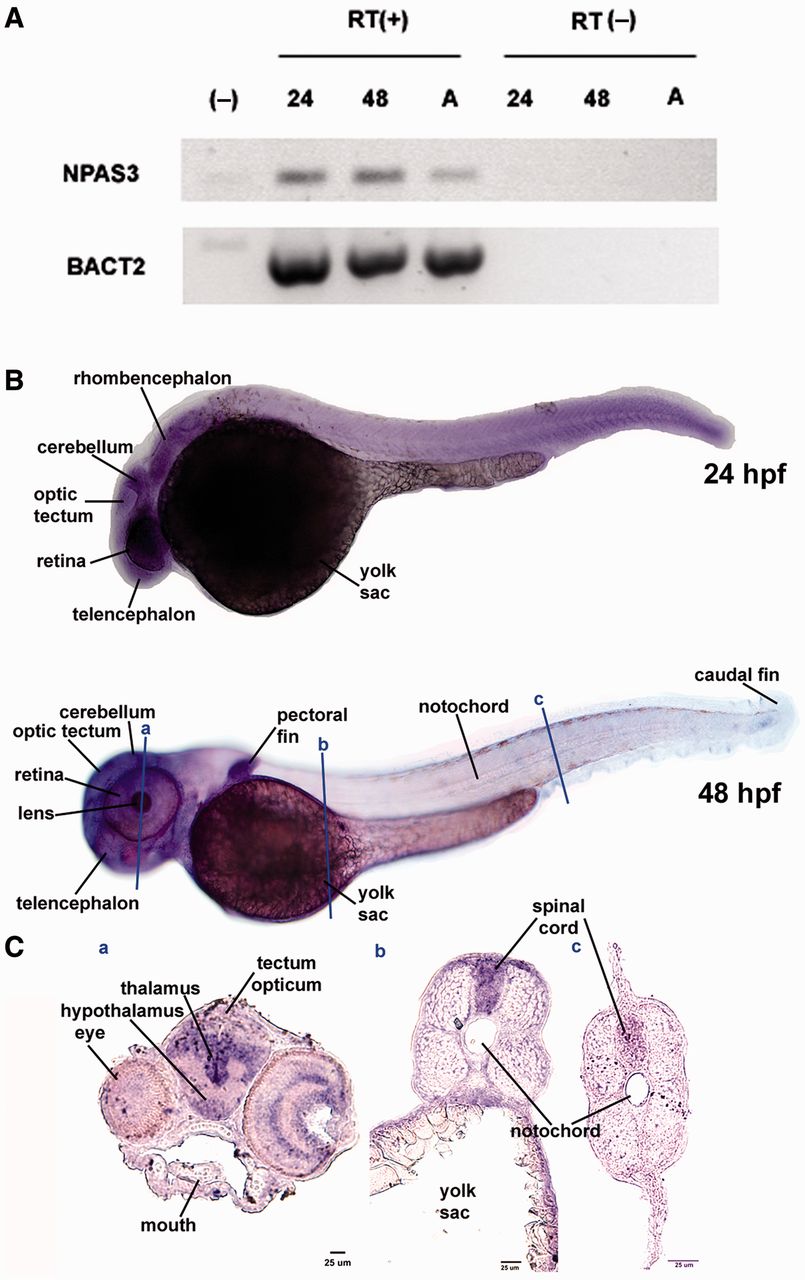
Fig. 2 Expression of the NPAS3 gene during zebrafish development. (A) RT-PCR analysis of NPAS3 expression in zebrafish embryos and adult brain. RT-PCR products of NPAS3 and control gene b-actin2 are shown: (-), negative control; 24, 24 hpf; 48, 48 hpf; A, adult brain with (+) or without (-) reverse transcriptase. (B) Whole mount in situ hybridization studies show the spatial expression pattern of the gene NPAS3 at 24 hpf (top) and 48 hpf (bottom). (C) In situ hybridization on coronal cryostat slices showing a detail of the NPAS3 expression pattern in 48 hpf zebrafish embryos.
Figure Data
Acknowledgments
This image is the copyrighted work of the attributed author or publisher, and
ZFIN has permission only to display this image to its users.
Additional permissions should be obtained from the applicable author or publisher of the image.
Full text @ Mol. Biol. Evol.