
|
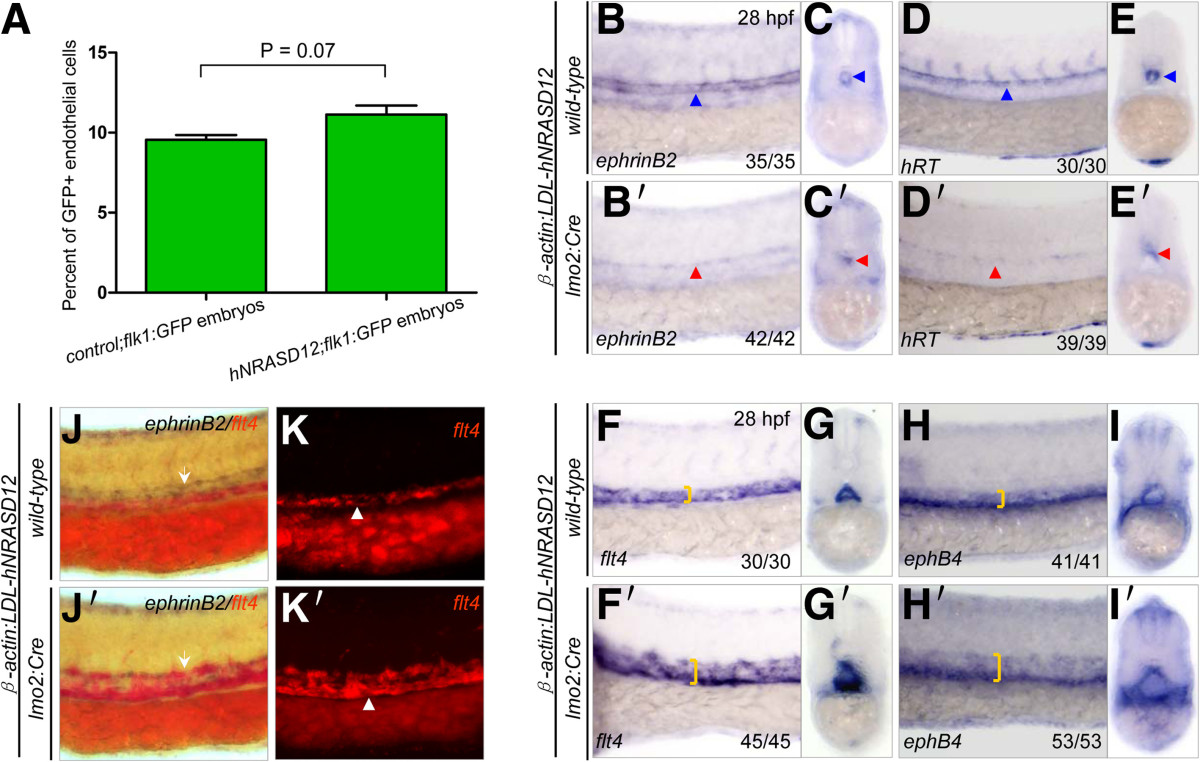
Fig. 6 Expression of hNRASD12 promotes venous specification at the expense of arterial fate during embryonic endothelial differentiation. (A) Quantitation of total endothelial cells by flow cytometry analysis on the control;flk1:GFP and hNRASD12;flk1:GFP embryos at 28 hpf. Representative results obtained from three independent experiments. 2 tailed t-test of frequency of endothelial cells in hNRASD12;flk1:GFP embryos vs control;flk1:GFP embryos shows no significant difference. (B-E′) WISH analysis of ephrinB2+ and hRT+ arterial cells in the trunk of control (B-E, blue triangles) and hNRASD12 embryos (B′-E′, red triangles) at 28 hpf. (F-I′) WISH analysis of flt4+ and ephB4+ venous cells in the trunk of control (F-I) and hNRASD12 embryos (F′-I′) at 28 hpf. The yellow square brackets mark the width of the venous strip in the trunk. (J-K′) 2-color WISH analysis with digoxigenin-labeled ephrinB2 (white arrows) and fluorescein-labeled flt4 (white triangles) in control (J, K) and hNRASD12 embryos (J′, K′) respectively at 28 hpf.