
|
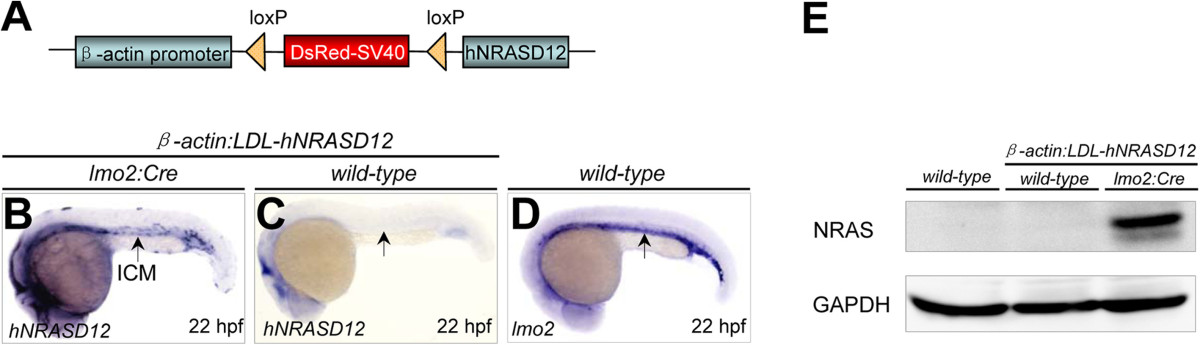
Fig. 1 Validation of hNRASD12 expression in the β-actin:LDL-hNRASD12;lmo2:Cre transgenic embryos. (A) Diagrammatic scheme of the β-actin-LDL-hNRASD12 transgenic construct. (B-D) The expression analyses of the hNRASD12 transcripts via whole mount in situ hybridization (WISH) in the β-actin:LDL-hNRASD12;lmo2:Cre embryo (hereafter referred as hNRASD12 embryo) (B) and β-actin:LDL-hNRASD12;wild-type embryo (hereafter referred as control embryo) (C) respectively at 22 hours post fertilization (hpf), and lom2 transcripts in the wild-type embryo at 22 hpf (D). Black arrows denote the location of the intermediate cell mass (ICM) region. (E) Confirmation of the expression of hNRAS protein in the hNRASD12-embryos at 28 hpf via western blotting analysis.