
|
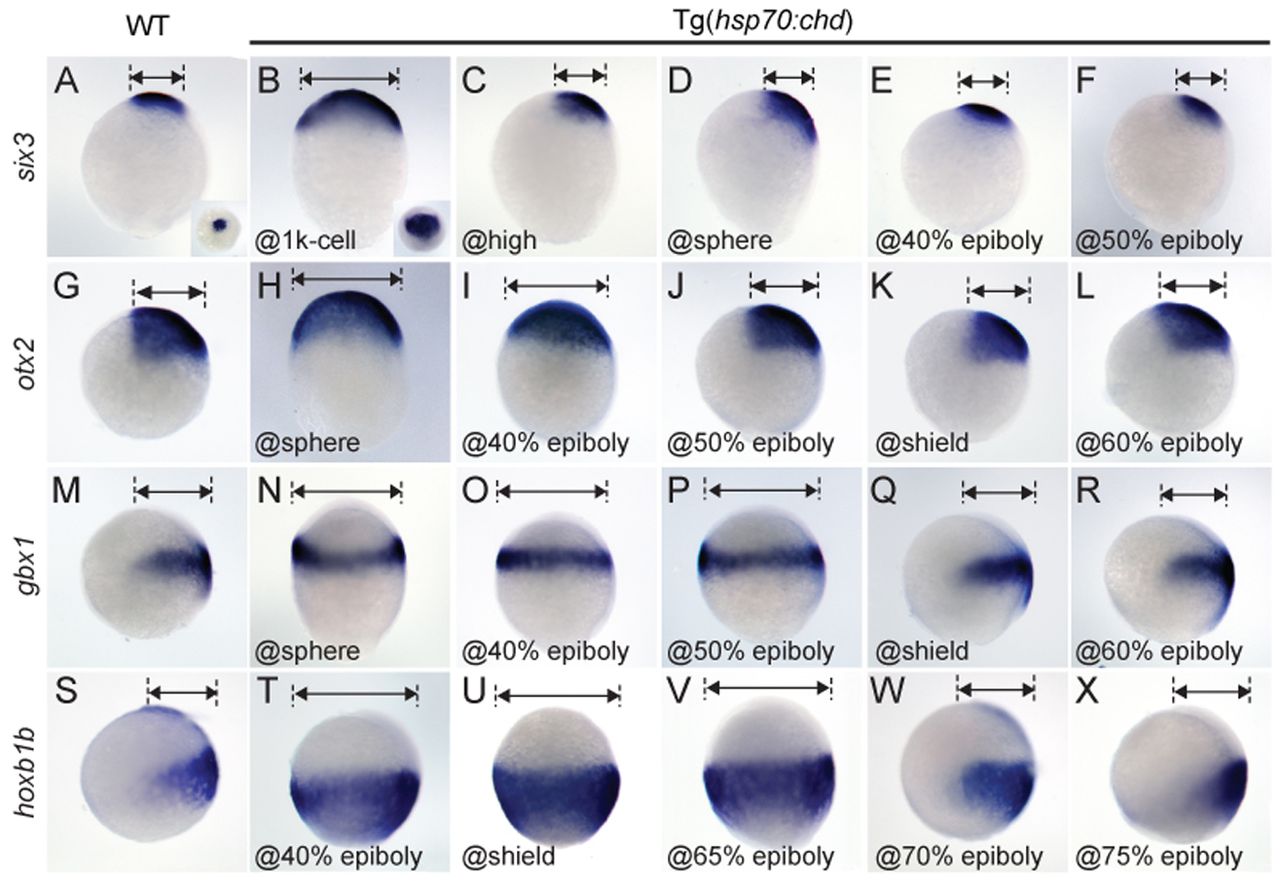
Fig. 1 Progressive DV neurectodermal patterning along the AP axis revealed by a Tg(hsp70:chd) BMP inhibition series. (A-F) six3, (G-L) otx2 and (M-R) gbx1 expression in anterior neurectoderm and (S-X) hoxb1b expression in posterior neurectoderm in non-heat shocked Tg(hsp70:chd) (WT) zebrafish embryos (A,G,M,S) and in Tg(hsp70:chd) embryos subject to heat shock (HS) at the indicated stages to inhibit BMP signaling (B-F,H-L,N-R,T-X). 1K-cell, 1000-cell stage. The DV width of the expression domain is indicated. Lateral views, dorsal to right, except for insets in A and B, which are animal pole views. (A-R) Shown at 80% epiboly stage; (S-X) shown at 90-95% epiboly stage. A, n=9/9; B, n=7/9; C, n=9/10; D, n=11/11; E, n=12/12; F, n=10/10; G, n=30/30; H, n=27/31; I, n=25/29; J, n=21/21; K, n=37/39; L, n=10/10; M, n=9/9; N, n=13/13; O, n=9/9; P, n=8/9; Q, n=9/10; R, n=10/10; S, n=32/32; T, n=26/27; U, n=21/22; V, n=28/29; W, n=17/20; X, n=20/21.