
Fig. 6
|
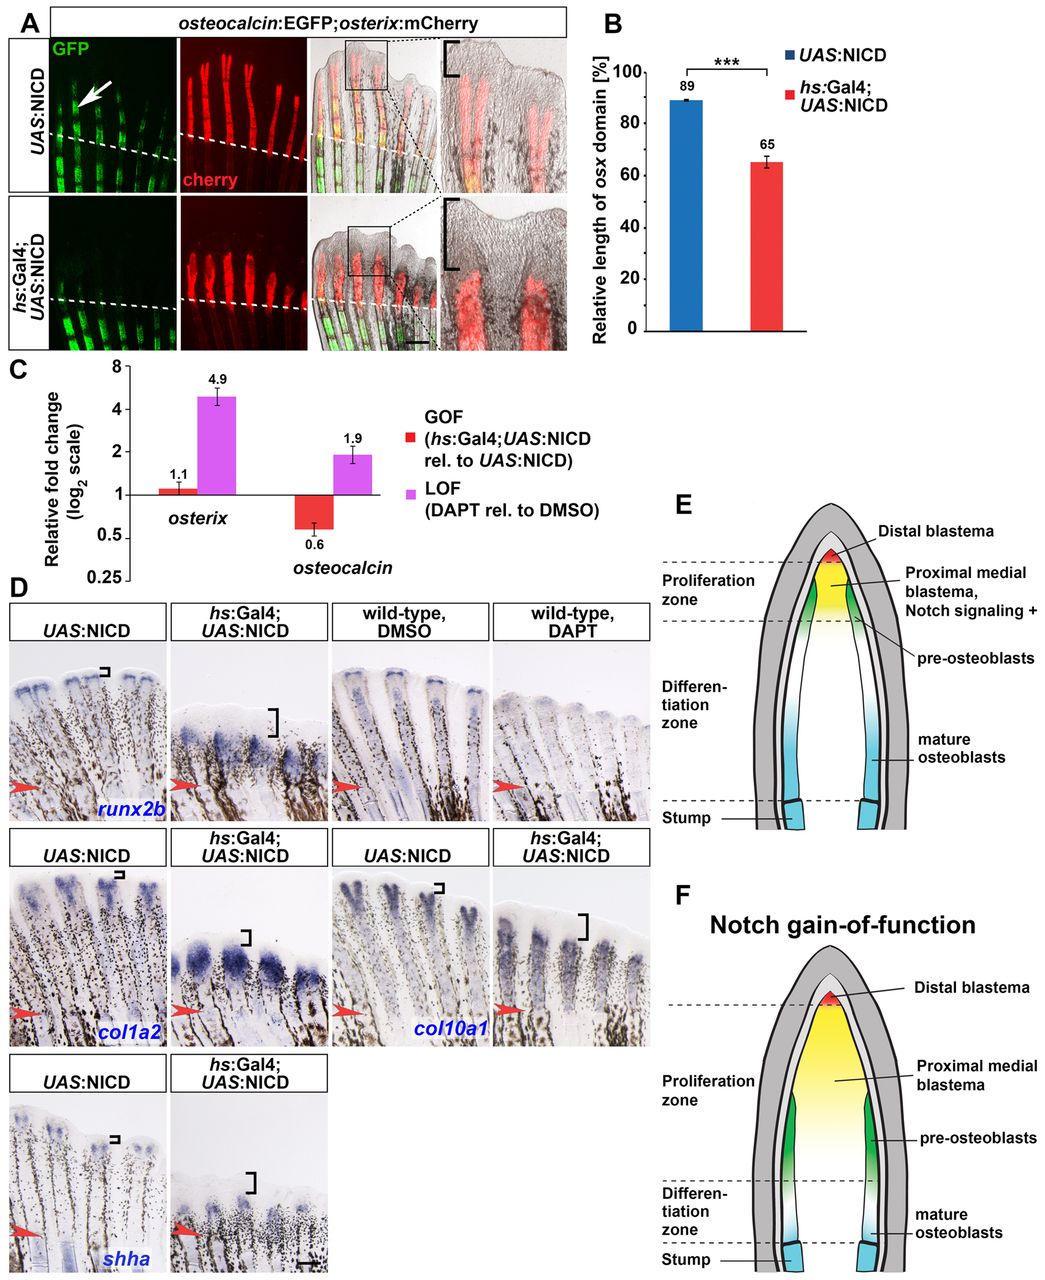
Fig. 6 Notch signaling negatively regulates osteoblast differentiation in the regenerating fin. (A) Altered bone marker expression in the regenerate of osteocalcin:EGFP; osterix:mCherry; hs:Gal4; UAS:NICD quadruple transgenic fish heatshocked repeatedly for 6 days. Dashed line indicates amputation plane. Scale bar: 200 μm. Arrows and brackets indicate osteocalcin: EGFP. (B) The fraction of the regenerate expressing osterix:mCherry in fish treated as in A. Mean±s.e.m. n=7 fins, 31 fin rays. ***P<0.001. (C) qRT-PCR shows upregulation of osteocalcin and osterix at 6 dpa in regenerates treated with DAPT for 4 days from 2 dpa onwards (loss of function), whereas osteocalcin is downregulated upon sustained NICD overexpression (gain of function) for 6 days. Mean±s.d., n=15 regenerates transgenics, 10 drug treatments. (D) Whole-mount in situ hybridization of the indicated markers in 6 dpa regenerates overexpressing NICD or treated with DAPT for 6 days. n=5/6, runx2b (hs:Gal4; UAS:NICD); n=12/13, runx2b (DAPT); n=6/6, col1a2; n=4/5, col10a1; n=5/7, shha. Arrowheads indicate amputation plane. Brackets indicate distal region devoid of marker expression. (E,F) Model depicting the spatial distribution of Notch signaling-positive cells in a longitudinal section of a wild-type fin regenerate (E) and the patterning consequences of Notch gain of function (F).