
|
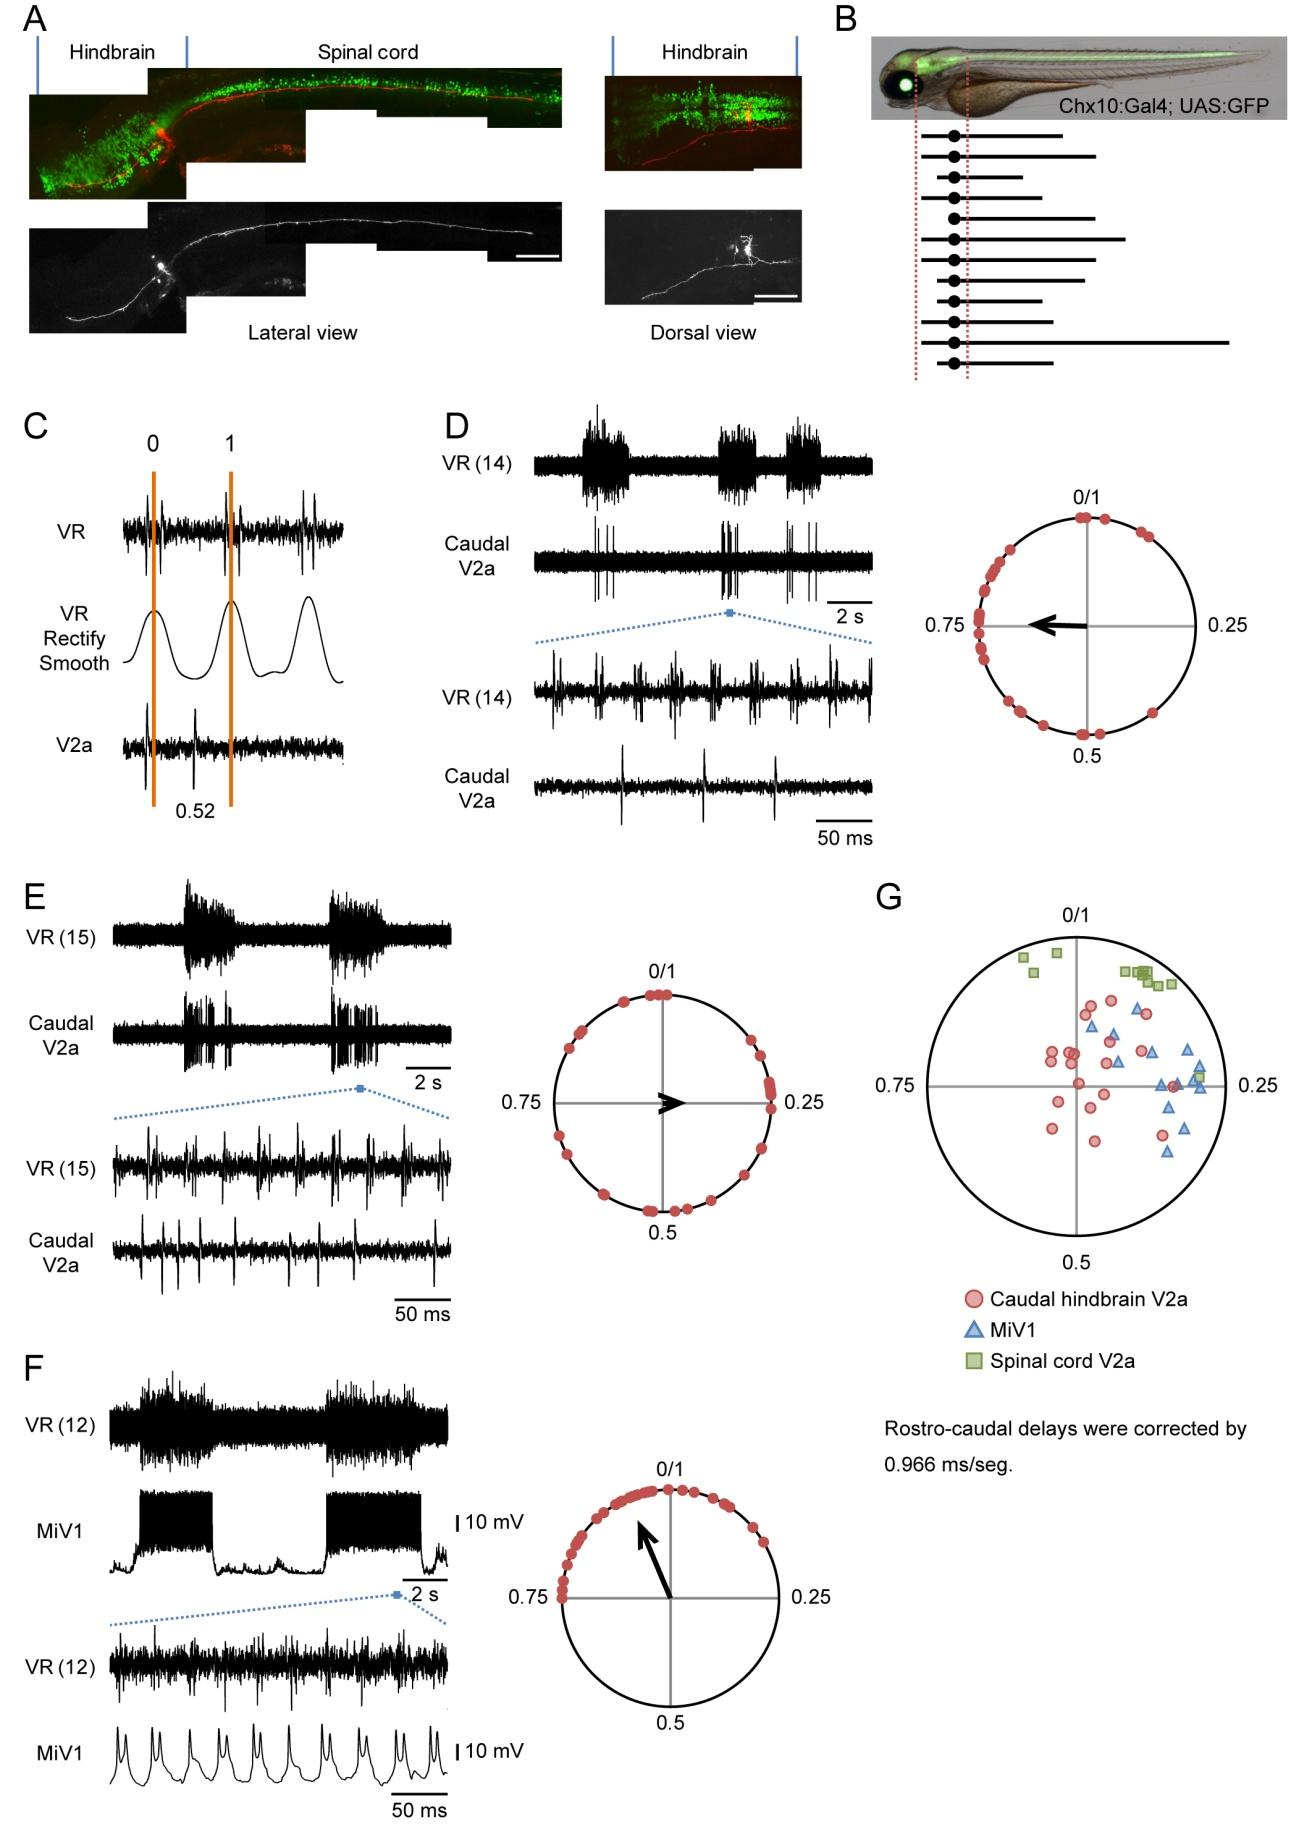
Fig. S5 Activity of hindbrain V2a neurons during fictive swimming Compound transgenic fish of Tg[chx10:Gal4] and Tg[UAS:GFP] at 3 dpf were used for the experiments. (A) and (B), Electroporations of rhodamin dye into the small V2a neurons in the caudal hindbrain. (A), A representative example. The left panels show lateral views of the labeled neurons. The right panels show dorsal views of the labeled neurons in the hindbrain. The neurons projected both rostrally and caudally. Scale bar, 100 μm. (B), Schematic views showing the trajectories of 12 neurons that were investigated. All of the neurons projected to the spinal cord. In addition, many of the neurons also had axons that projected rostrally in the hindbrain. (C), The method to determine the phase value in the circular plot. VR recordings (top) are rectified and smoothened (middle). The phase values of 0 and 1 are given to a central time point of a VR activity and that of the next VR activity, respectively. Then, phase values are given to spikes of V2a neurons (bottom). (D) and (E), Loose-patch recordings from the small reticulo-spinal V2a neurons in the caudal hindbrain. The numbers in parentheses indicate the locations of the VR recordings. The right panels show circular plots that show the phasic relation of V2a neuron spikes to VR activity. The phase values of 30 randomly selected spikes are plotted in the circles. (F), A whole-cell recording of a MiV1 neuron. The numbers in parentheses indicate the locations of the VR recordings. The right panels show a circular plot that shows the phasic relation of MiV1 neuron spikes to the VR activity. The phase values of 30 randomly selected spikes are plotted in the circles. (G), The apexes of the vectors of the recorded neurons are plotted in a circle. For the small reticulo-spinal V2a neurons in the caudal hindbrain, only those neurons whose firing frequencies were more than 0.1 are included. The phase values in this plot are compensated such that VR recordings would have been made at the position of the recorded neurons by using the value of 0.966 ms/segment. n = 20 for the small reticulo-spinal V2a neurons; n = 14 for the MiV1 neurons; and n = 12 for the spinal V2a neurons.