
|
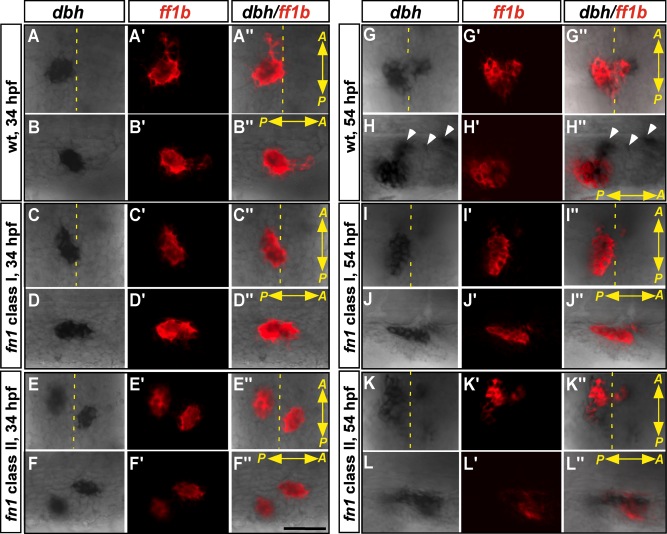
Fig. 4 The interaction between interrenal and chromaffin cells in the fn1 mutant at 34 and 54 hpf. Double ISH assays showing the colocalization of ff1b (red) with dbh (black) in the class I and II fn1 mutants, as well as their wild-type siblings. Ventral flat mount (A–A′′, C–C′′, E–E′′, G–G′′, I–I′′, K–K′′) and lateral (B–B′′, D–D′′, F–F′′, H–H′′, J–J′′, L–L″) views are shown for the representative embryo of each phenotypic type (n =17, 10, and 24 for the 34-hpf fn1 mutant class I, class II, and their wild-type siblings, respectively; n = 6, 3, and 18 for the 54-hpf fn1 mutant class I, class II, and their wild-type siblings, respectively). The anterior (A) versus posterior (P) orientation of each sample is indicated, and the midline is marked by yellow dotted lines. The embryos in the lateral view panels are oriented with the dorsal side to the top, and migrating chromaffin cell clusters are highlighted by white arrowheads. The initial interaction between interrenal and chromaffin cell populations appears normal; while the continuous recruitment of chromaffin cells to the interrenal region is defective in the fn1 mutant. Scale bar = 50 μM.