
|
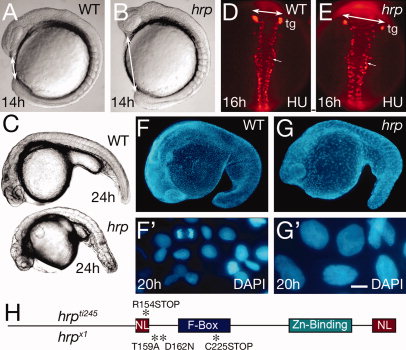
Fig. 1
General phenotype of harpy mutants. A,B: Live wild-type (WT) and mutant embryos at the 10 somite stage. Double sided arrows indicate the distinctive nose–tail bud separation in the mutants. C: Side views of live wild-type and mutant embryos at 24 hr. D,E: Anti-HuC (HU) stained neurons at 16 hr in wild-type and mutant embryos. The trigeminal ganglia (tg) are indicated, and double sided arrows indicate the width of the neural keel. Small arrows indicate single cells; note the larger size of the mutant cells. F,G: The 42,6-diamidine-2-phenylidole-dihydrochloride (DAPI) staining at 20 hr in wild-type and mutant embryos. F2 and G2 are whole embryo dissociations. Note the cell in mitosis in the WT field; no cells are found in mitosis in the mutants. H: Rca1/emi1 coding region showing individual protein domains and the locations of point mutations (asterisks) found in hrpti245 and hrpx1 mutants. Scale bar = 50 μm in D,E, 5 μm in F2,G2.