
|
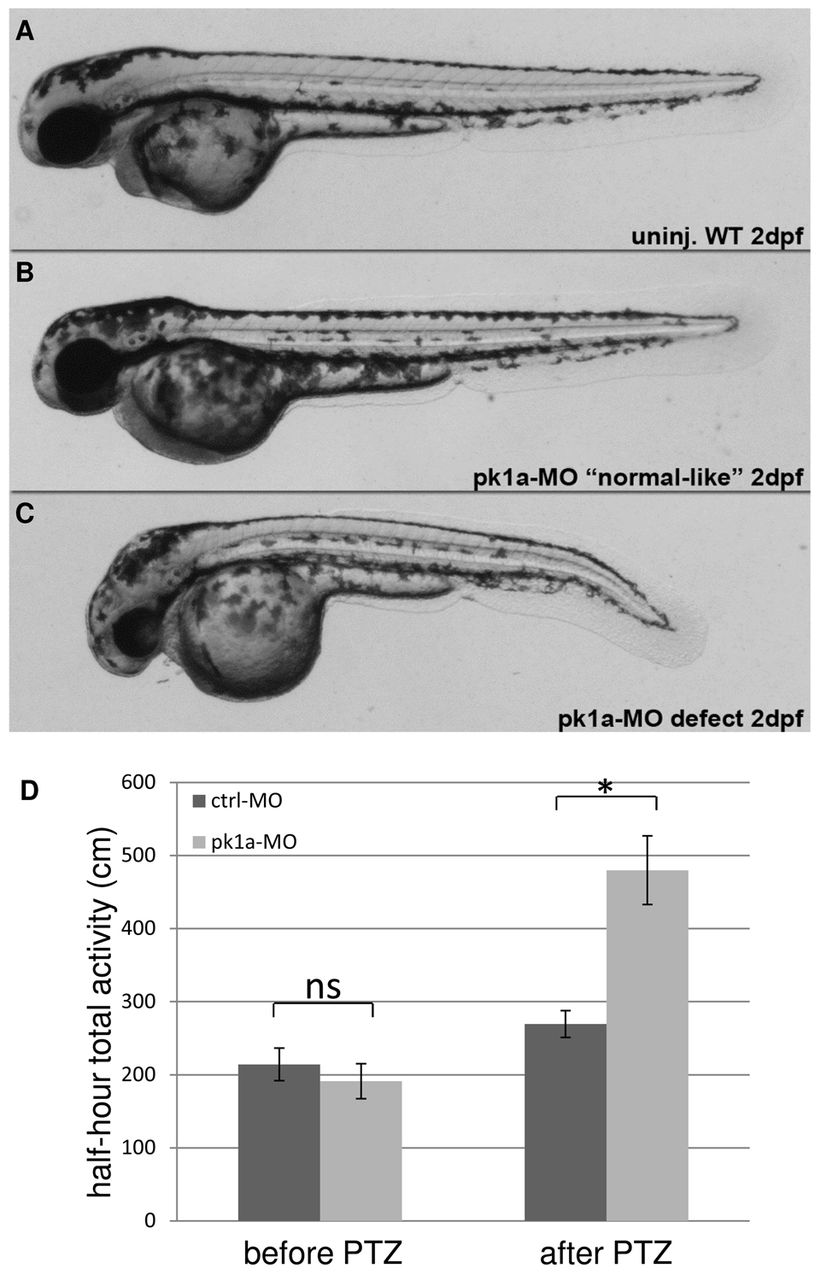
Fig. 2 pk1a knockdown sensitizes zebrafish to PTZ treatment. (A-C) Morphology of wild-type and pk1a-MO-injected embryos at 2 dpf: wild-type uninjected embryo (A); pk1a-MO-injected embryos ranging from ‘normal-like’ (B) to curved body axis (C). (D) Graph of total half-hour activity before and after PTZ treatment for larvae injected with control-MO and pk1a-MO. Wilcoxon Rank Sum test found no significant increase (ns) in activity of control-MO and pk1a-MO injected larvae prior to PTZ treatment. There was a significant increase in activity in control after PTZ compared with control before PTZ (P<0.05) and for pk1a morphants after PTZ compared with before PTZ (P<0.05). *P<0.05 is the significant difference between control and pk1a morphant after PTZ treatment. For control-MO, n=48 and for pk1a-MO, n=48. Data presented as mean ± s.e.m.