
|
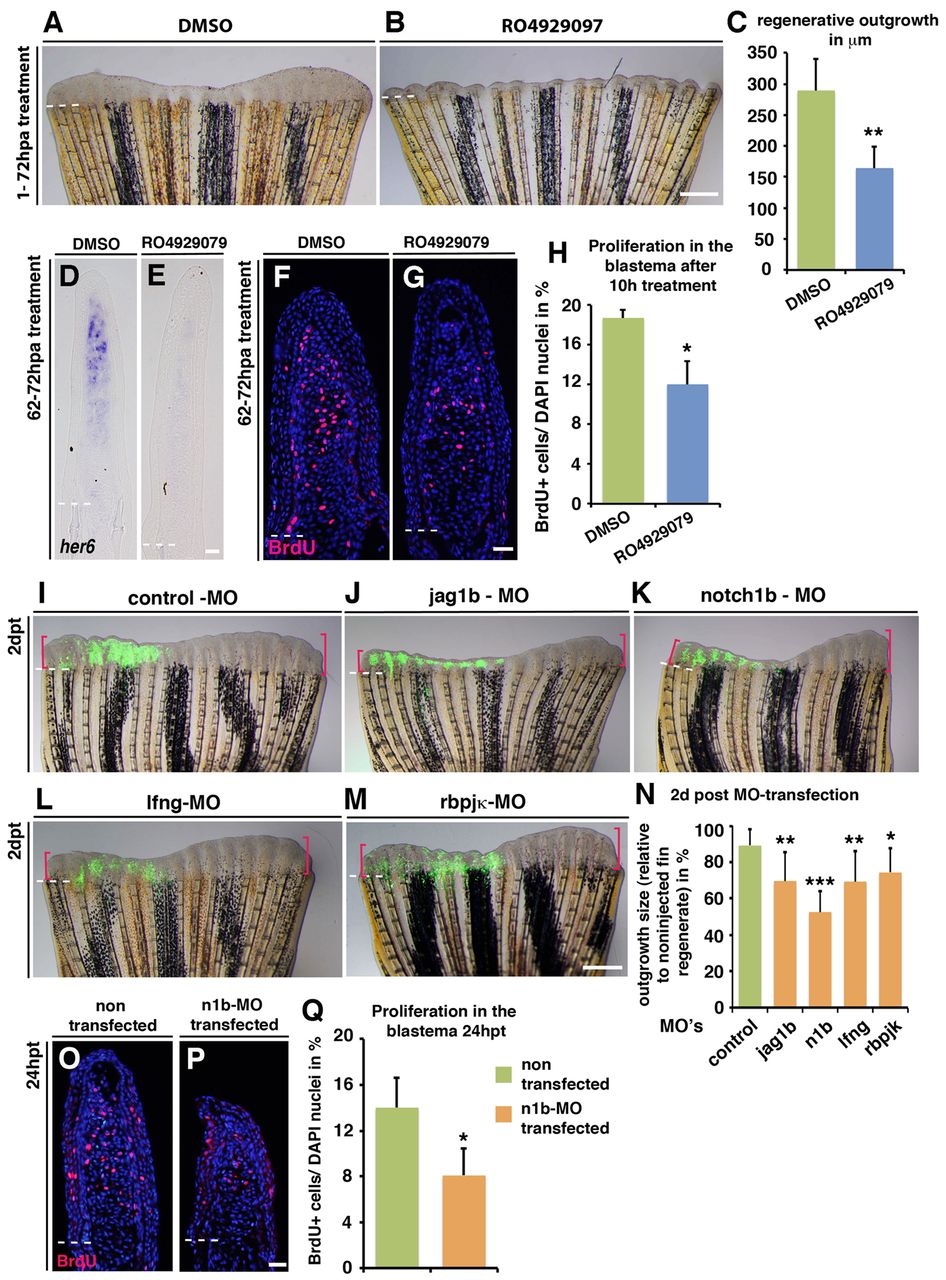
Fig. 3
Notch signalling inactivation impairs regeneration by decreasing proliferation. (A,B) Fish were treated with DMSO or 10 µM RO4929097 for 3 days starting at 1 hpa. Fin regeneration is blocked by RO4929097 treatment. (C) Mean length of fin regenerates (n=5); **P<0.01. (D,E) In situ hybridization of her6 showing Notch activity in regenerating fins treated with DMSO from 62 to 72 hpa (D) but not in RO4929097-treated fins (E). (F-H) BrdU-stained fin sections and quantification of BrdU+ cells within the mesenchyme of RO4929097-treated fins (G; n=5) and DMSO-treated fins (F; n=6). *P<0.05. (I-M) Fins microinjected in the dorsal half with fluorescein-labelled morpholinos (MO, green) and electroporated at 2 days post-transfection (dpt): control (I; n=9), jag1b (J; n=12), notch1b (K; n=9), lfng (L; n=12) or rbpjκ (M; n=6). The ventral half serves as an internal control. Pink brackets mark maximal regenerative outgrowth at 2 dpt. (N) Mean outgrowth size of the dorsal (MO-electroporated) half of the fin relative to the ventral half at 4 dpa/2 dpt. *P<0.05, **P<0.01 and ***P<0.005 versus control. (O,P) BrdU-stained fin sections and quantification of BrdU+ cells within the mesenchyme. (Q) Mean percentage of DAPI+ blastema cells in fin sections incorporating BrdU at 3 dpa/24 hpt (n=3). *P<0.05. Proliferation is reduced in notch1b-MO-transfected fin halves. Scale bars: 1 mm in B; 10 μm in E,G; 1 mm in M; 10 μm in P. Broken lines indicate the amputation plane.