
|
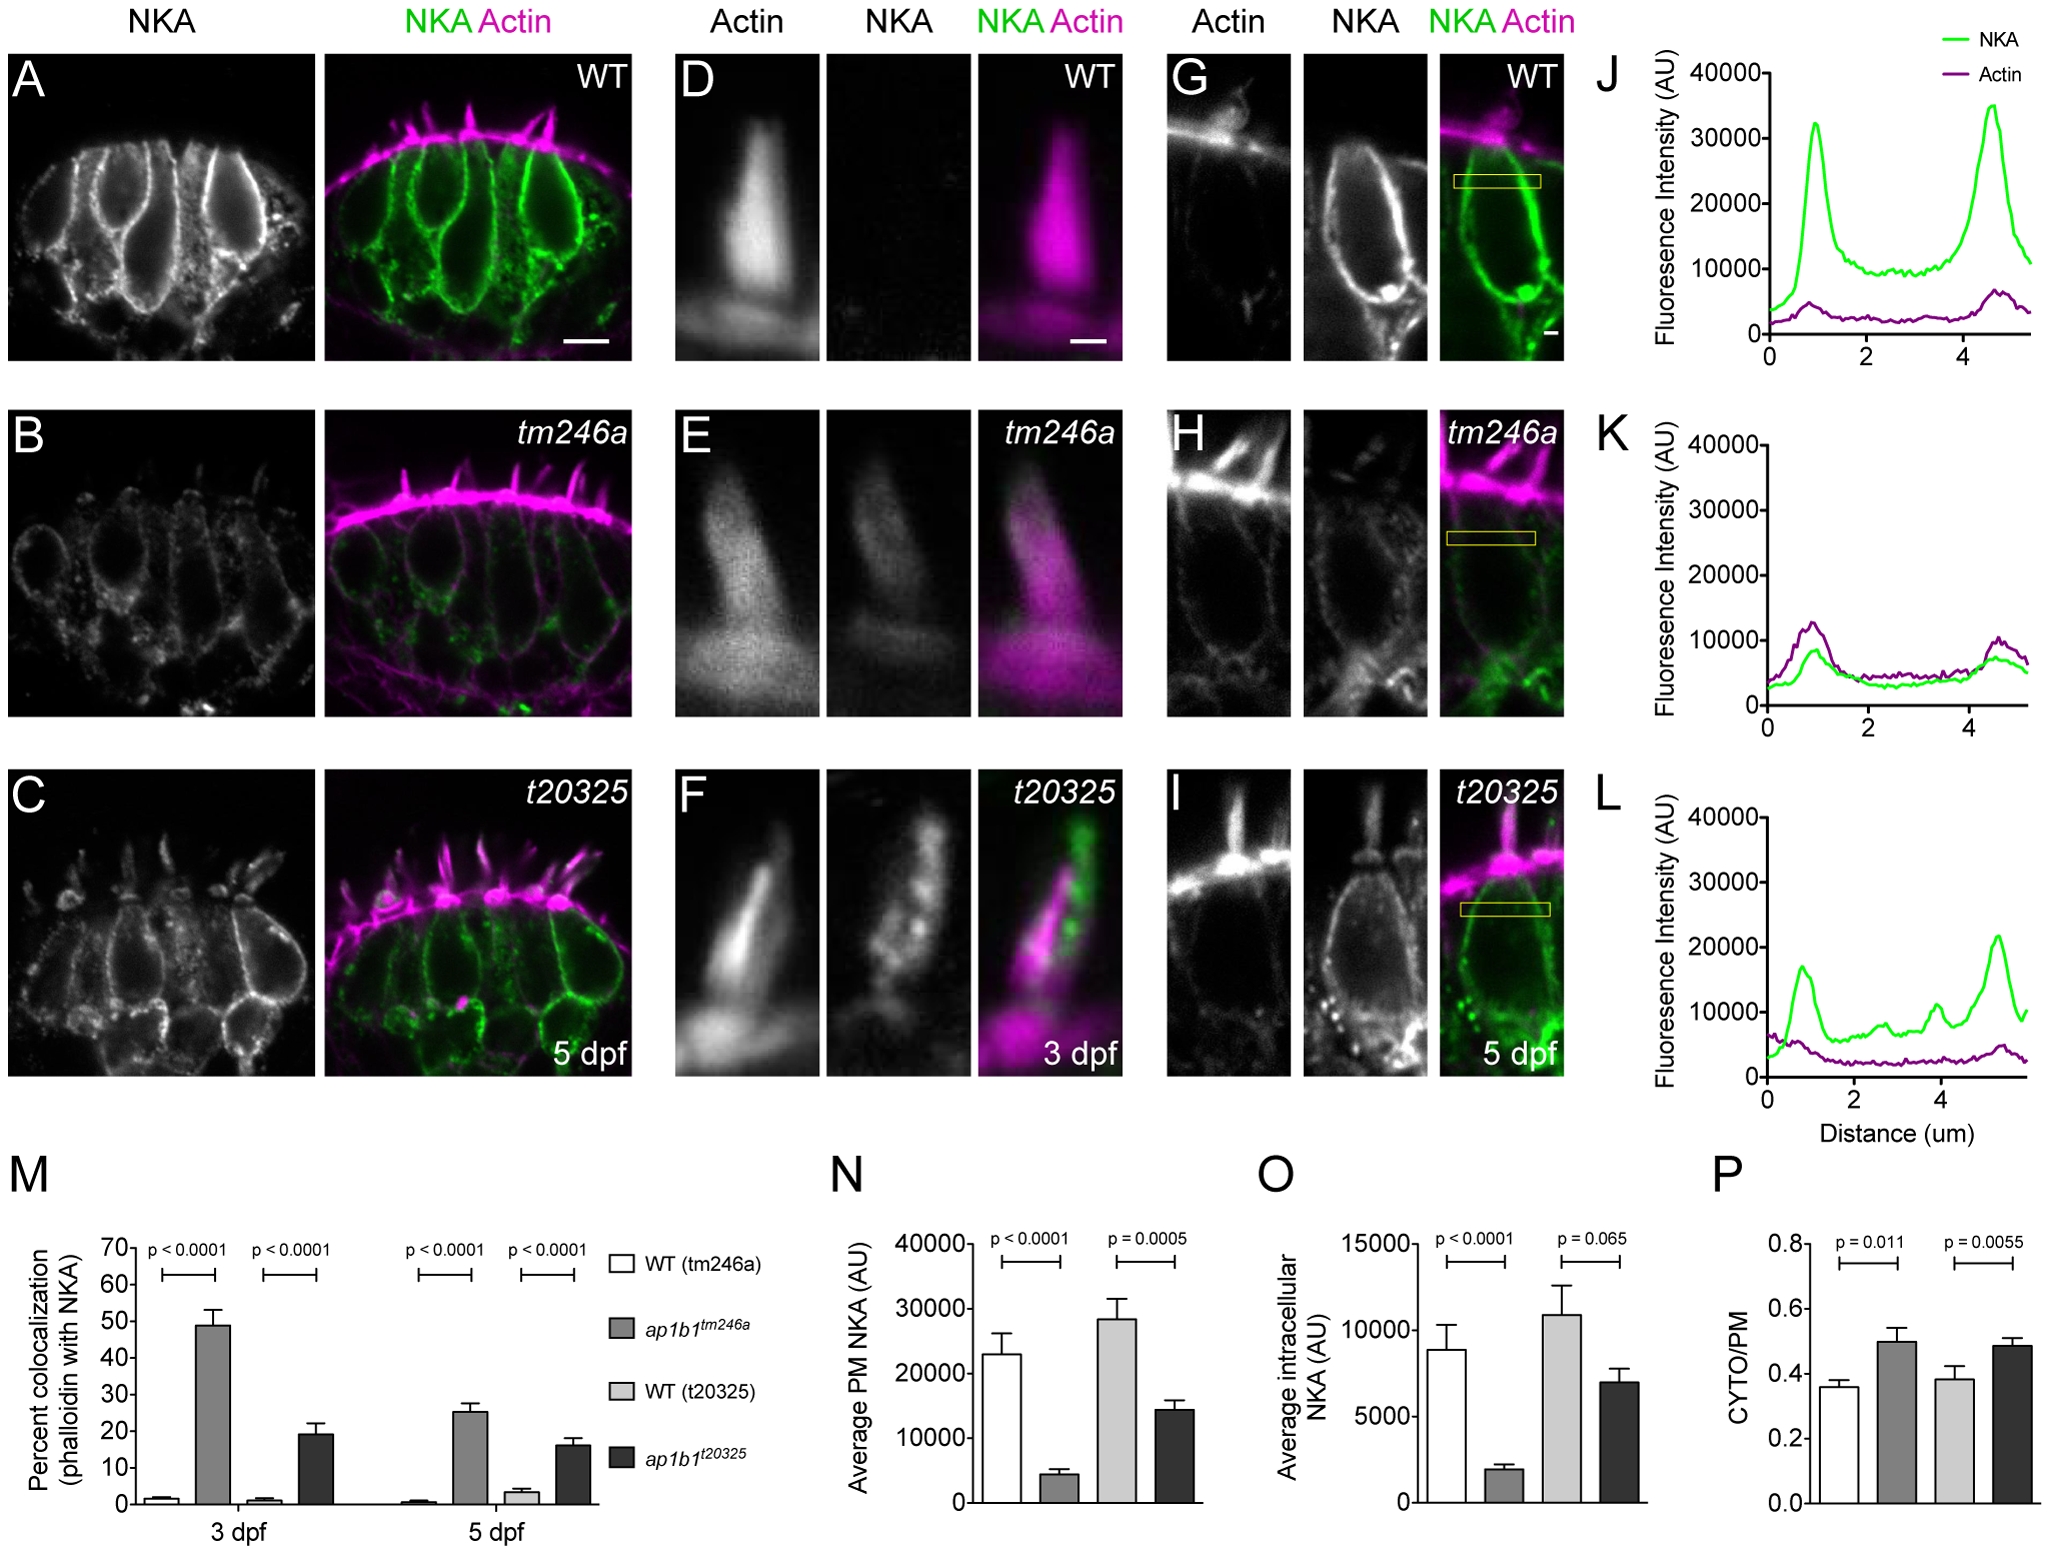
Fig. 6
NKA is missorted to hair bundles in ap1b1 mutant HCs.
A–C, NKA antibody label of the lateral crista of WT and tm246a and t20325 mutants at 5 dpf, respectively. Scale bar, 5 μm. D–F, Magnified examples of a single representative hair bundle in the cristae in WT, tm246a and t20325 mutants at 3 dpf. Scale bar, 1 μm. G–I, Representative HCs from which fluorescence profile plots were obtained. Yellow boxes indicate the region used for generating profile plots. Scale bar, 1 μm. J–L, Profile plots showing fluorescence intensity of the distribution of NKA immunolabel in WT and tm246a and t20325 mutant HCs shown in G, H and I, respectively. The green trace indicates NKA immunolabel and the magenta trace indicates phalloidin labeling. M, Quantification showing the average percent of NKA positive phalloidin pixels in WT and mutant stereocilia at both 3 (tm246a: WT n = 45, mutant n = 37; t20325: WT n = 39, mutant n = 53 bundles) and 5 dpf (tm246a: WT n = 46, mutant n = 72; t20325: WT n = 44, mutant n = 62 bundles) from e4 larvae. N, Quantification of NKA fluorescence (A.U.) at the membrane at 5 dpf. N, Quantification of intracellular NKA fluorescence (A.U.). O, Quantification of intracellular NKA fluorescence (A.U.) at 5 dpf. P, The ratio of intracellular NKA (CYTO) to plasma membrane localized NKA (PM). For N–P, tm246a: WT n = 19, mutant n = 16; t20325: WT n = 18, mutant n = 21 HCs. Error bars in M–P represent SEM and statistical difference determined with a Mann-Whitney U-test.