
|
Fig. 1
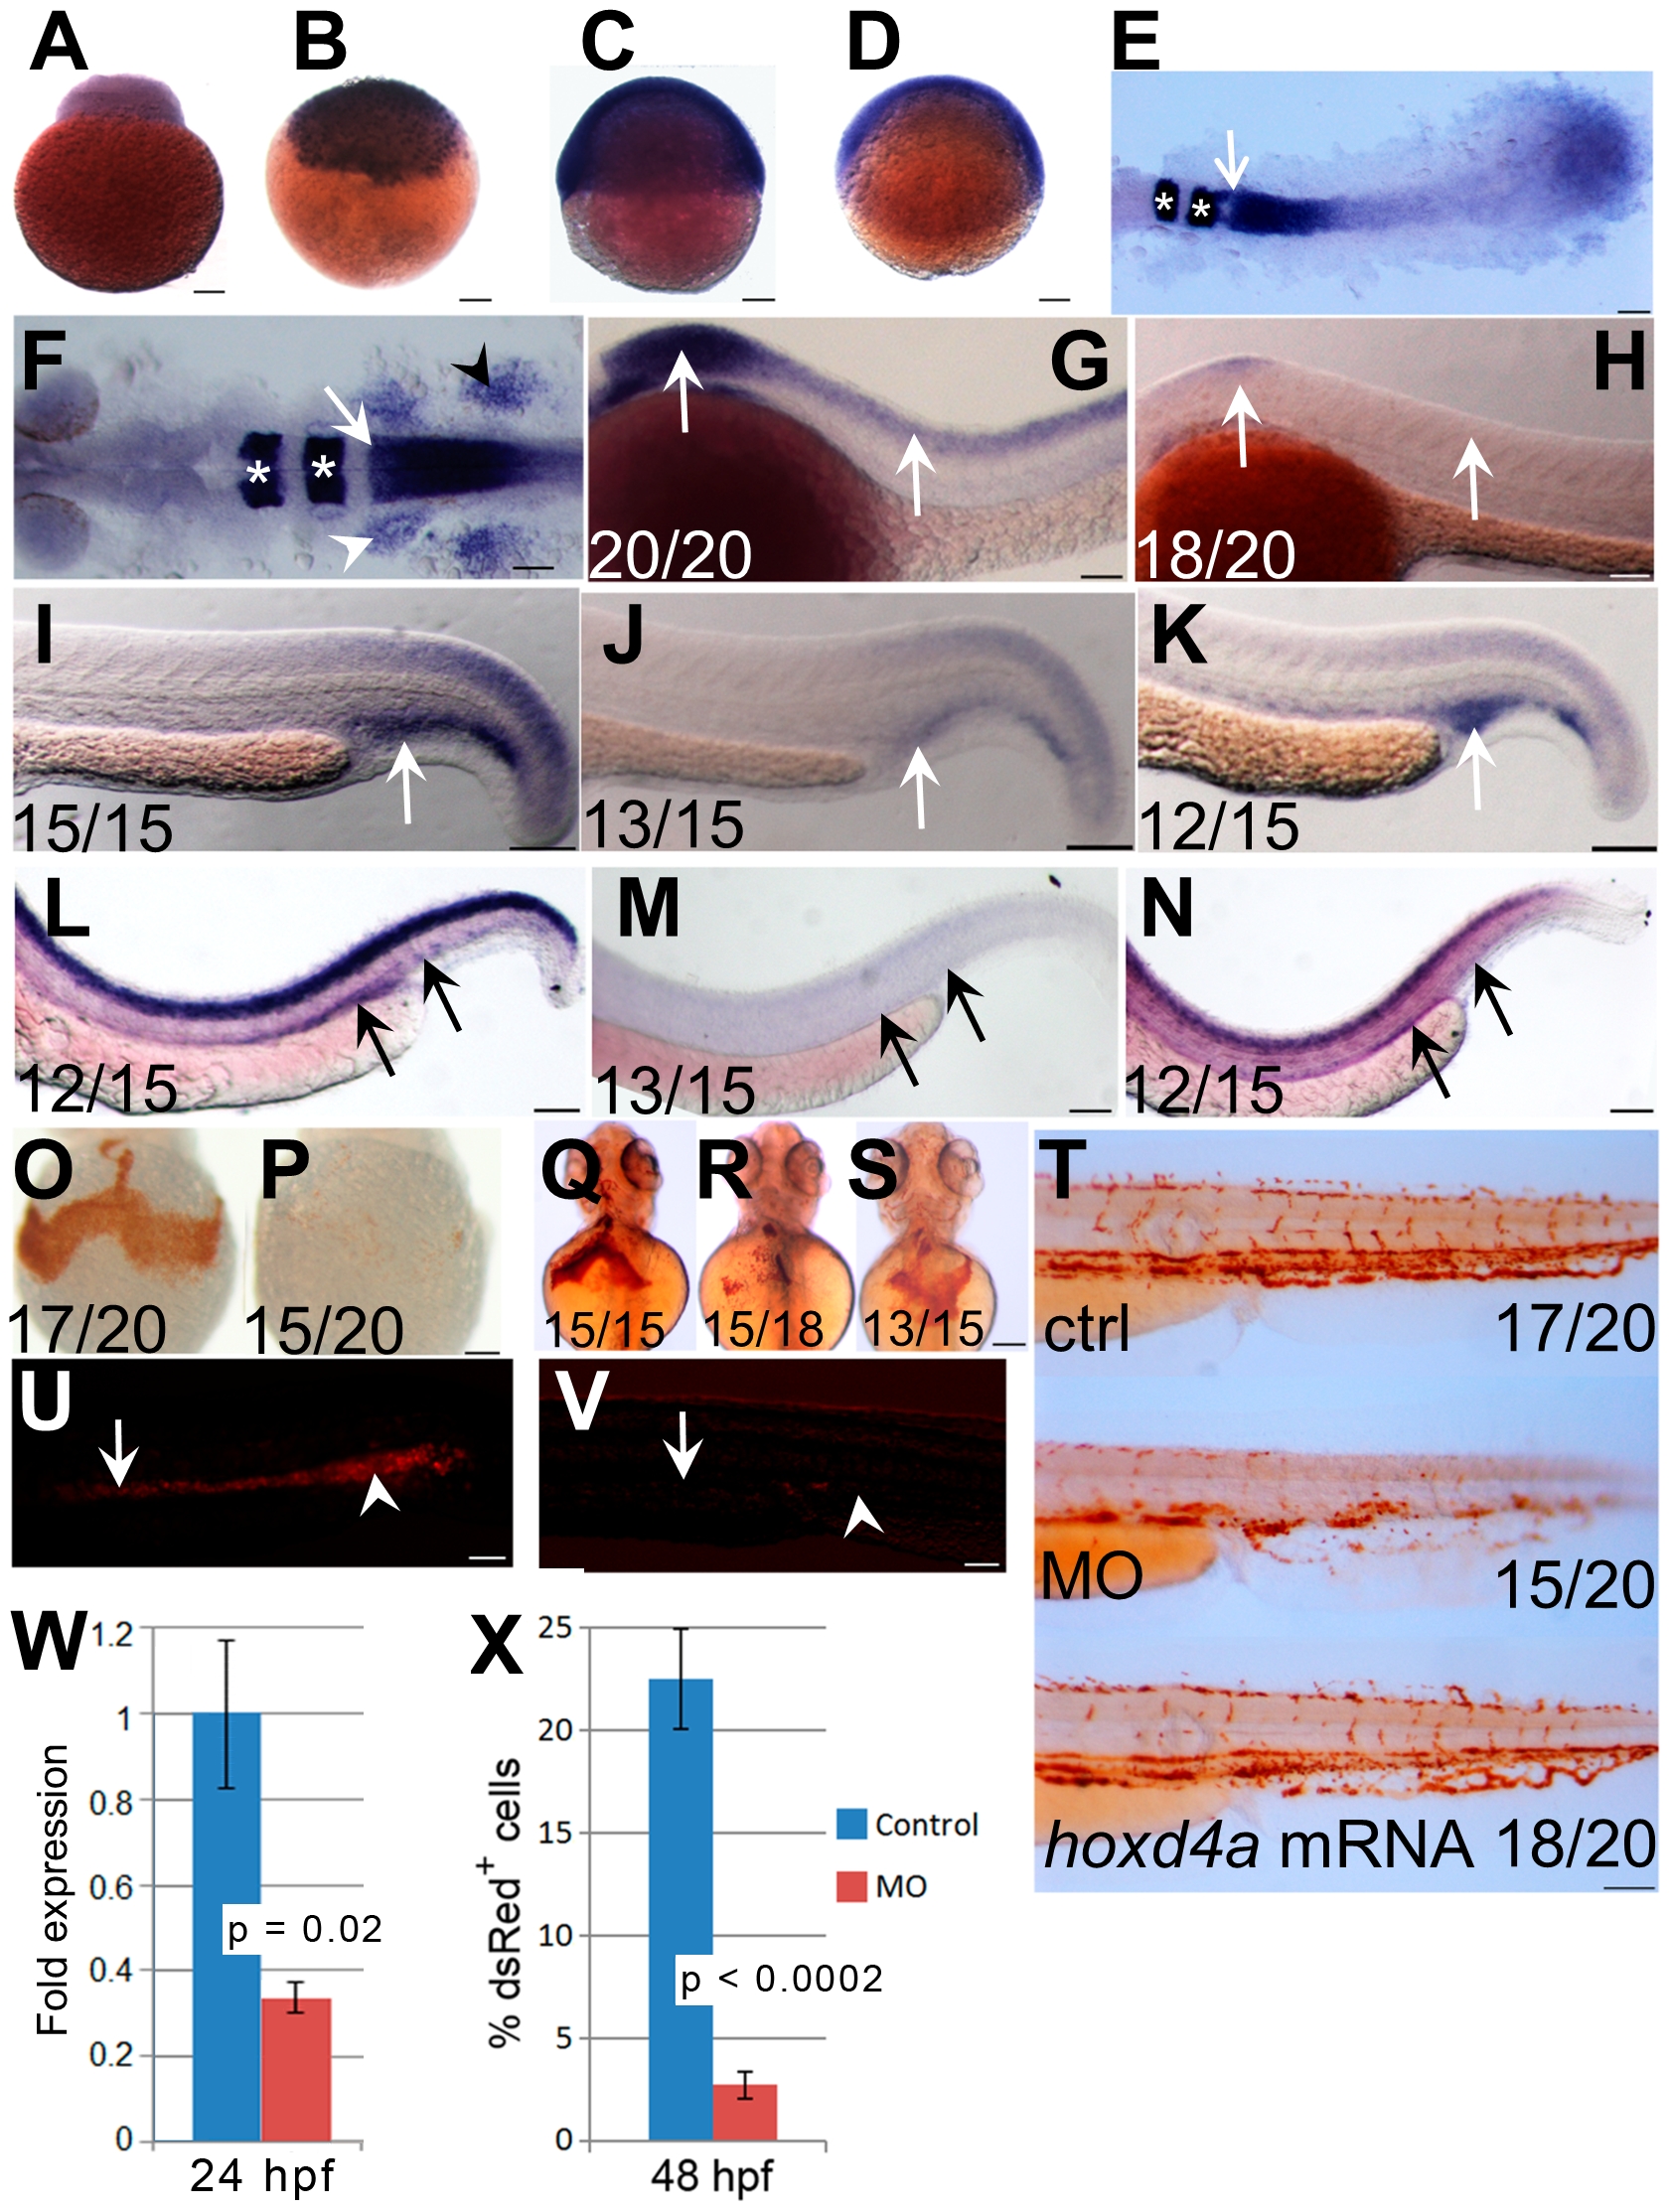
Expression pattern of hoxd4a and phenotype of hoxd4a morphants.
(A–D) Detection of hoxd4a transcripts in early zebrafish embryos. Animal pole is to the top. (A) 1 cell. (B) 3 hpf. (C) 50% epiboly. (D) 75% epiboly. (E) Dorsal view of flat-mounted embryo at 12 hpf (5–6 somites) doubly stained for expression of hoxd4a and krox20a. The arrow indicates the anterior expression border of hoxd4a, while asterisks denote expression of krox20a in r3 and r5. Anterior is to the left. The rostral-most portion of the embryo is not captured in the image. (F) Dorsal view of a flat-mounted embryo at 26–28 hpf (>26 somites) showing hoxd4a expression in hindbrain, branchial arches (white arrowhead, left side only) and pectoral fin field (black arrowhead, right side only). The white arrow marks the hoxd4a anterior expression border in the hindbrain at the boundary between r6 and r7. Asterisks denote krox20a expression in r3 and r5. (G–H) Lateral views of 26–28 hpf embryos showing hoxd4a expression in the central nervous system (arrows) of control embryos (G) and reduced expression in hoxd4a morphants (H). (I–K) hoxd4a expression in the caudal half at 26–28 hpf as shown in lateral views, anterior to the left. hoxd4a expression seen in the PBI of control embryos (I, white arrow) is greatly reduced in hoxd4a morphants (J). Expression is rescued following co-injection with capped hoxd4a mRNA (K). (L–N) Results of In situ hybridization for hoxd4a at 48 hpf showing expression in the AGM and caudal vein plexus (site of future CHT) of control injected embryos (L, black arrows), greatly reduced expression in hoxd4a morphants (M), and rescued expression in embryos simultaneously injected with capped mRNA for hoxd4a (N). (O–T) Hemoglobin within RBCs revealed by o-dianisidine staining. Ventral views at 48 hpf (O,P) and 72 hpf (Q,R) show greatly reduced levels of hemoglobin in the ducts of Cuvier in hoxd4a morphants (P and R) vs controls (O and Q). Co-injection with capped mRNA for hoxd4a results in rescued RBC production (S). (T) O-dianisidine staining of the caudal half of a control larva (upper panel) and hoxd4a morphant (middle panel) showing overall reduction in hemoglobin levels at 72 hpf in morphants, and rescue by co-injection of capped hoxd4a mRNA (lower panel). (U,V) Lateral views of trunk regions of Tg(gata1:dsRed) embryos at 26 hpf, anterior to the left. The expression of dsRed within proerythroblasts is readily detected in the ICM (arrow) and PBI (arrowhead) of control-injected embryos (U) but not hoxd4a morphants (V). Scale bars = 100 µm. Ratios indicate the number of embryos showing the presented phenotype. (W) qRT-PCR shows an overall 3-fold reduction of hoxd4a expression in morphants at 26–28 hpf. Error bars = standard error. p = 0.02. (X) Quantitation by flow cytometry of dsRed-positive cells in Tg(gata1:dsRed) embryos at 48 hpf showing that morphants display an 88% reduction in RBCs relative to control-injected embryos. Error bars = standard deviation. p<0.0002.