
Image
|
Figure Caption
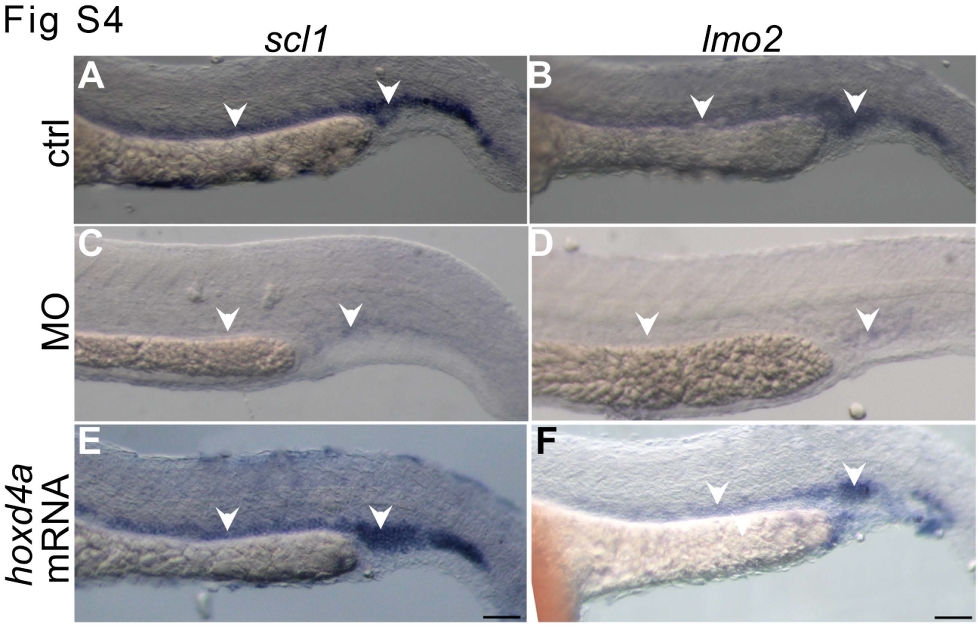
Fig. S4
Reduced expression of scl and lmo2 in hoxd4a morphants at 26–28 hpf. (A–J) Expression analysis of scl (A,C,E) and lmo2 (B,D,F) at 26–28 hpf. Normal expression of scl and lmo2 (A,B) is severely reduced in hoxd4a morphants (C,D) and rescued by co-injection with capped mRNA for hoxd4a (E,F) All images present lateral views with anterior to the left and dorsal on top. Scale bars equal 100 µm. All images are at the same magnification.
Acknowledgments
This image is the copyrighted work of the attributed author or publisher, and
ZFIN has permission only to display this image to its users.
Additional permissions should be obtained from the applicable author or publisher of the image.
Full text @ PLoS One