
|
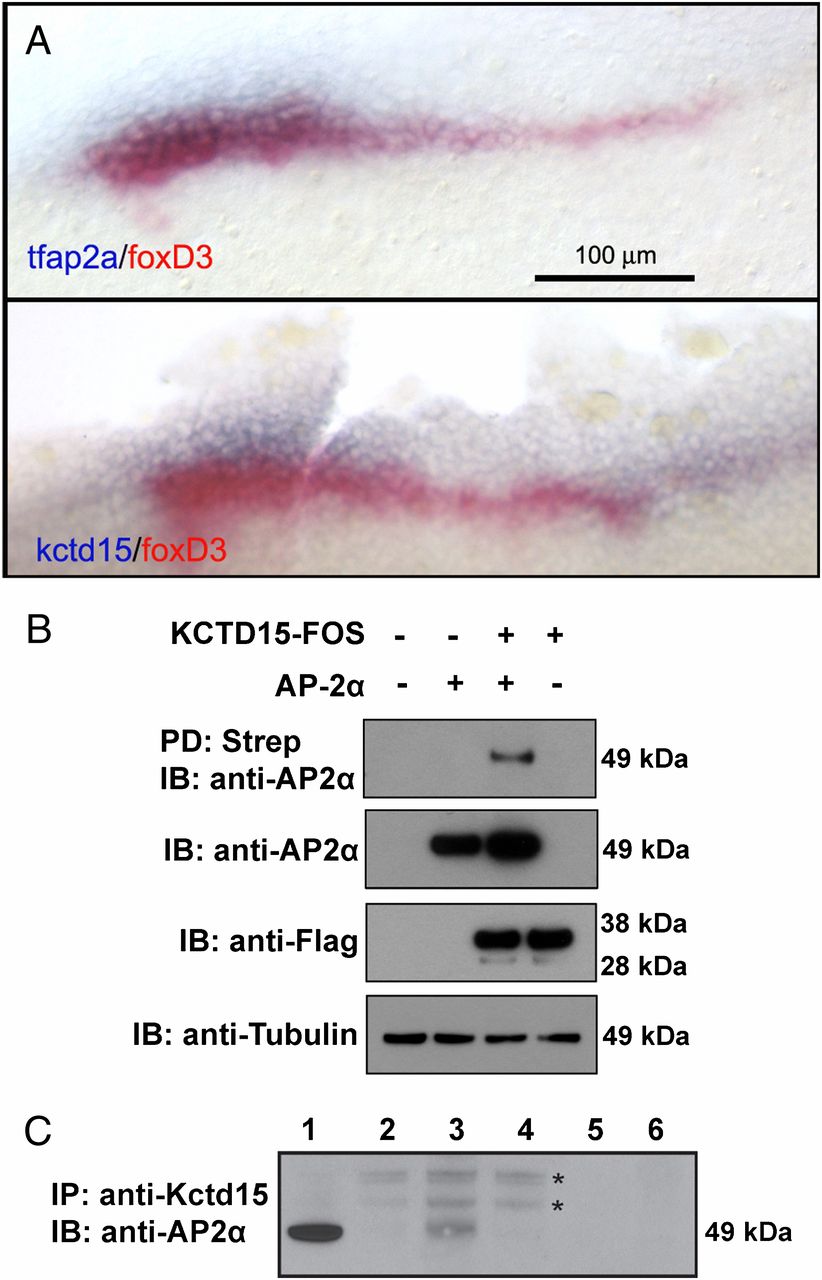
Fig. 1 Kctd15 and tfap2 expression overlaps in zebrafish embryos, and the protein products interact physically. (A) Expression domains of tfap2a and kctd15 (both blue) are compared with foxD3 (red). Anterior to the left, midline to bottom. (B) KCTD15 and AP-2α interact in mammalian cells. KCTD15 tagged with FOS and TFAP2a were cotransfected into HEK293T cells. Immunoblotting (IB) was carried out with Flag, AP-2α, and tubulin antibodies. (C) Co-IP of endogenous AP-2α and Kctd15 in one-somite-stage embryo extracts. Lanes are as follows: 1: AP-2α marker from co-IP of zAP-2α and Kctd15 expressed in HEK293T cells; 2: beads plus embryo extract, used as control; 3: beads plus embryo extract and anti-Kctd15 antibody; 4: beads plus buffer; 5: empty; 6: input, embryo lysate. Lanes 2 and 3 contain extract from 100 embryos, whereas lane 6 could be loaded with 3 embryos only because of high protein levels; therefore no band is seen. Background bands indicated by asterisks.