
|
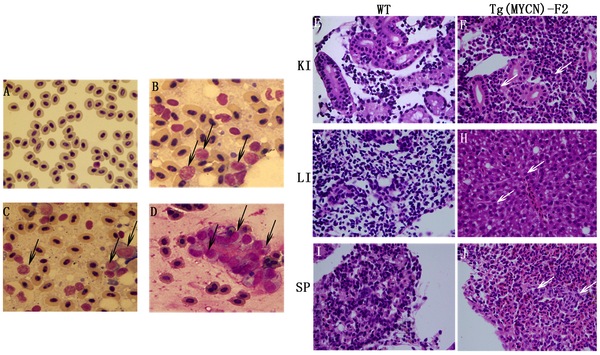
Fig. 2 Cytological analysis of Tg(MYCN:HSE:EGFP) zebrafish.Cytology of hematopoietic cells from WT (A) and Tg(MYCN:HSE:EGFP) F0, F1, F2 generation (B, C, D) zebrafish at 60 dpf.
The blood cells from WT fish were predominantly erythrocytes, with myeloid cells only occasionally observed. By contrast, erythrocytes were significantly inhibited in Tg fish, enriched for abundant blast-like cells, which are larger than the erythrocytes and have high nuclear to cytoplasmic ratios, containing multiple large nucleoli (black arrow). These blasts were similar to that of human AML peripheral blood. Transverse sections of kidney, liver, and spleen of WT (E, G and I) and Tg(MYCN:HSE:EGFP) F2 generation (F, H and J) zebrafish. Using HE staining, it showed that massive immature hematopoietic cells infiltrated in these organs of Tg fish (white arrow). KI, kidney; LI, liver; SP, spleen. (×1,000)