
|
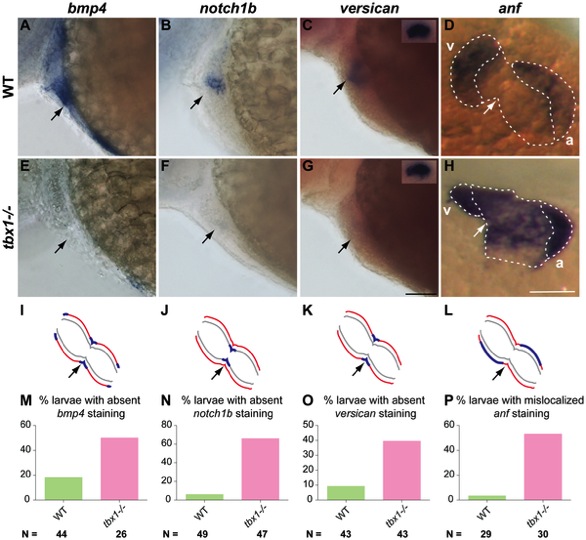
Fig. 3 Regional differentiation defects in tbx1-/- mutants.
48 hpf embryos stained for region-specific markers (A–H) and their schematic representation (I–L). Red lines indicate myocardium, grey lines indicate endocardium and blue lines indicate gene expression. bmp4 (OFT, AVC and IFT), notch1b (AVC endocardium) and versican (AVC myocardium) expression is down-regulated in tbx1-/- mutants (E–G) as compared to WT siblings (A–C). The insets in C and G show versican expression in the ear as a control for ISH. anf expression is localized to the outer parts of the chamber myocardium in WT (D), but is broadly expressed in the ventricle and atrium in tbx1-/- mutants (H). Arrows point to the AVC in all panels; v, ventricle; a, atrium. The plots in M–P show the penetrance of the phenotype as percentage embryos with absent/mis-localized expression of the respective gene. N depicts the total number of embryos represented in the plot. Scale bars: 50 μm.