
|
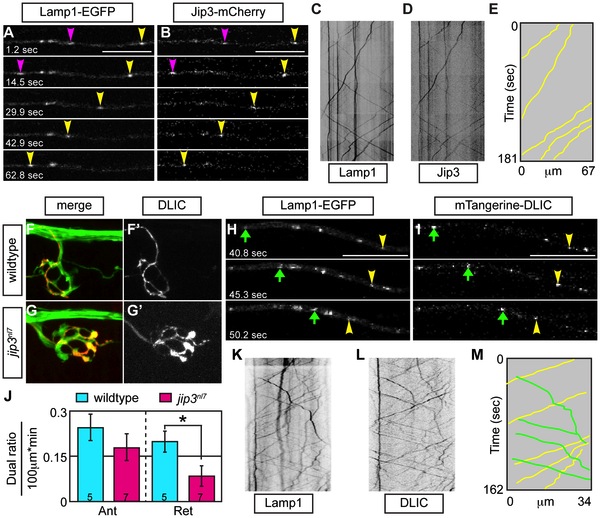
Fig. 8 Jip3 scaffolds lysosomes to DLIC for retrograde transport.
(A,B) Stills from a wildtype imaging session at 3 dpf in which Lamp1-EGFP (A) and Jip3-mCherry (B) co-transport was analyzed (Video S10). Pink and yellow arrowheads point to two retrograde Jip3/Lamp1 positive cargos. (C,D) Kymographs generated from this imaging session for individual cargos. (E) Schematized kymograph of co-transport. Yellow lines denote Jip3-positive lysosomes moving in the retrograde direction. (F,G) mTangerine-DLIC expression in a wildtype (F) and jip3nl7 mutant (G) NM1 axon terminal at 3 dpf. (H,I) Stills from analysis of Lamp1 (H) and DLIC (I) co-transport at 3 dpf in a wildtype (Video S11). Green arrow-anterograde co-labeled puncta. Yellow arrowhead-DLIC positive lysosome undergoing retrograde transport. (J) The ratio of DLIC positive lysosomes moving in the retrograde direction was significantly decreased in jip3nl7 mutants (ANOVA, *-p<0.05; Anterograde-Ant; Retrograde-Ret). (K–M) Kymographs from this imaging session and schematized kymograph depicting co-labeled anterograde lysosomes in green and retrograde in yellow.