
Fig. 5
- ID
- ZDB-IMAGE-130425-23
- Publication
- Drerup et al., 2013 - JNK-Interacting Protein 3 Mediates the Retrograde Transport of Activated c-Jun N-Terminal Kinase and Lysosomes
- All Figures
- Figures for Drerup et al., 2013
|
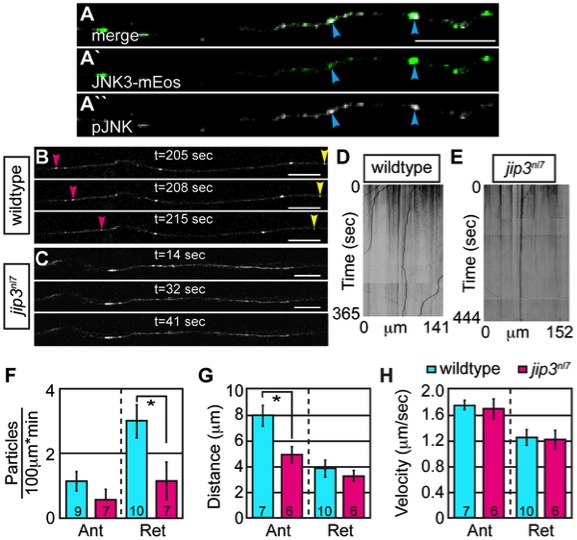
Fig. 5 Retrograde JNK3 transport frequency was decreased in jip3nl7 mutants.
(A) Immunolabeling for pJNK in an axon expressing JNK3-mEos showed a high degree of colocalization (arrowheads) indicating that a large percentage of axonal JNK3-mEos is activated. (B,C) Representative stills from a live imaging session showing axonal transport of JNK3-mEos in a pLL axon of a wildtype (B) and jip3nl7 mutant (C) at 2 dpf (see Videos S6 and S7). Pink arrowhead denotes anterograde movement, yellow retrograde movement. (D,E) Kymographs generated from these imaging sessions. (F) Number of retrograde JNK3-mEos puncta (corrected for size of analyzed region and time of imaging session) was decreased in jip3nl7 (ANOVA, post-hoc contrasts; *-p<0.05). Distance of individual retrograde movement bouts (G) and velocity (H) were unaltered in jip3nl7. Anterograde transport distance was decreased (*-p<0.05; Ant = anterograde; Ret = retrograde). Scale bars = 10 μm.