
|
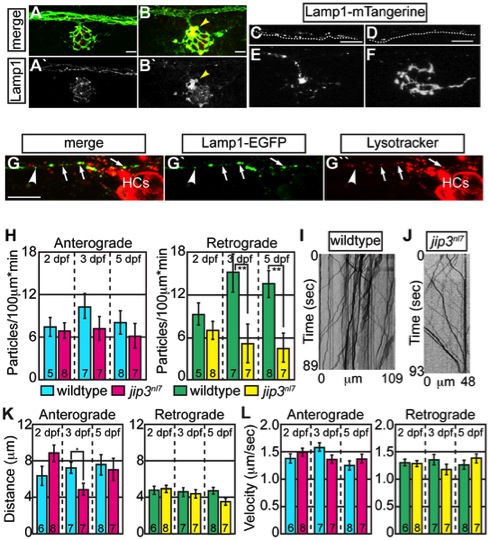
Fig. 2 Lysosomes accumulated in jip3nl7 axon terminal swellings.
(A,B) Lysosome density, as assayed by Lamp1 immunolabeling (A,B-red, A′B′-white) was increased in jip3nl7 NM3 axon terminals at 5 dpf (arrowhead). Larvae carried the neurod:EGFP transgene to label pLL axons. (C,D) Stills from imaging sessions of Lamp1-mTangerine transport in the pLL nerve of wildtype (C) and jip3nl7 mutant (D) embryos at 3 dpf (Videos S4 and S5). Dotted lines denote the lower bound of the axons imaged. (E,F) Lamp1-mTangerine accumulated in the axon terminals of jip3nl7 mutants (F) but not wildtype siblings (E) at 3 dpf (NM1 shown for both). (G) The majority of Lamp1-EGFP positive vesicles in axons co-labeled with Lysotracker red, indicating they were lysosomes. Arrows denote a subset of the Lamp1-EGFP/Lysotracker red co-labeled vesicles. Arrowhead points to a small Lamp1 positive vesicle that was not acidified. HC denotes hair cells rich in Lysotracker red positive, acidic vesicles. (H) Retrograde, but not anterograde, lysosome transport frequency was decreased in jip3nl7 mutants at 3 and 5 dpf (Wilcoxon rank-sum; **-p<0.005). Number of embryos analyzed is indicated on the graph for this and all subsequent bar graphs. (I,J) Kymographs of wildtype (I) and jip3nl7 (J) Lamp1-mTangerine transport shown in C and D. (K,L) Neither distance moved in individual bouts (K) nor velocity of movement (L) were altered in jip3nl7 mutants, save a decrease in anterograde transport distance at 3 dpf (Wilcoxon rank-sum; *p<0.05). Scale bars = 10 μm.