
|
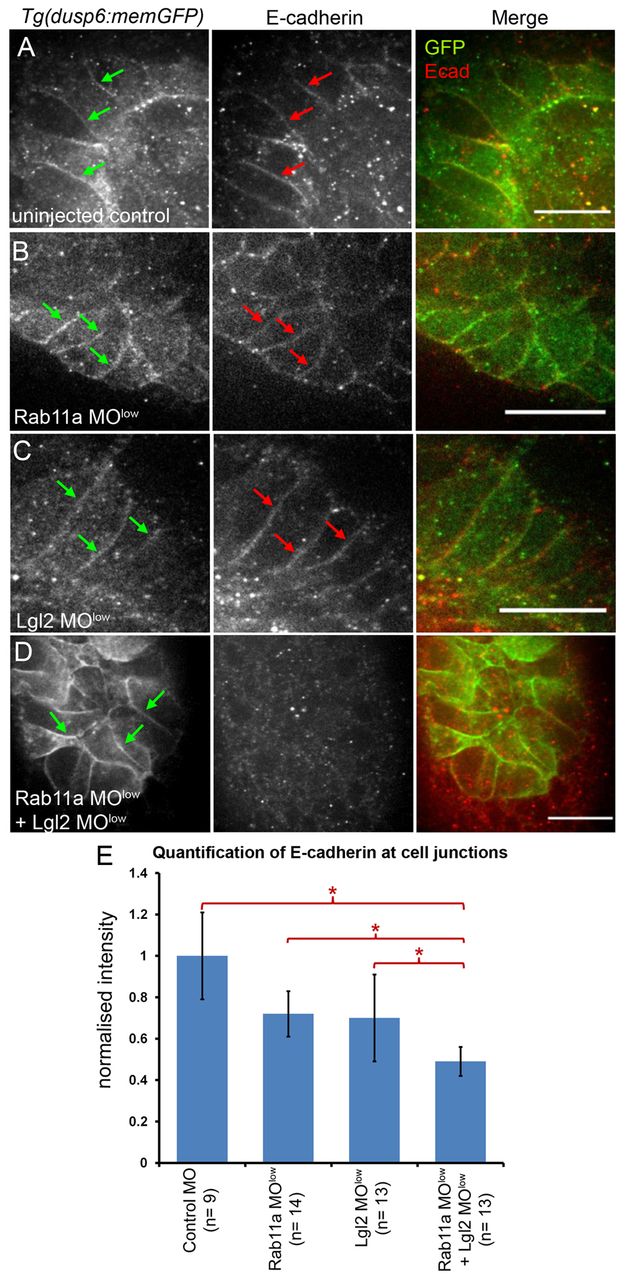
Fig. 6 Lgl2 and Rab11a control E-cadherin accumulation at KV cell junctions. (A-D) Optical sections showing E-cadherin immunostaining in KV cells of Tg(dusp6:memGFP) embryos. GFP (green arrows) and E-cadherin (red arrows) accumulate at lateral membranes in control (A), Rab11a MOlow (B) and Lgl2 MOlow (C) embryos. E-cadherin membrane staining was reduced in Rab11a MOlow + Lgl2 MOlow embryos (D). Scale bars: 20 μm. (E) Quantification of E-cadherin staining along lateral KV membranes. Average fluorescence intensities from multiple experiments were normalized to controls. Error bars indicate s.d. n, number of embryos analyzed. *P<0.05.