
|
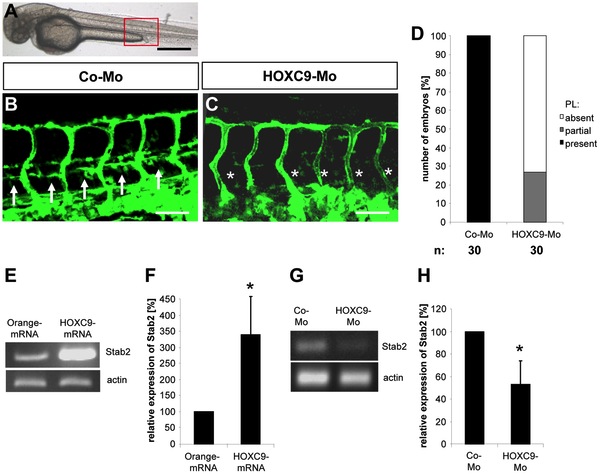
Fig. 1
Silencing of HOXC9 expression in zebrafish inhibits assembly of parachordal lymphangioplasts (PLs).
(A) Overall morphology of 48 hpf zebrafish embryo after control morpholino injection. Red box shows region displayed in (B) and (C). (B) Normal formation of the PLs (arrows) in 48 hpf tg(fli1:EGFP) zebrafish embryo after injection of 4 ng control morpholino. (C) Silencing of HOXC9 expression using 2 ng translational-blocking morpholino disrupted the formation of the PLs (asterisks) in 48 hpf tg(fli1:EGFP) zebrafish embryo. (D) Quantification of 48 hpf tg(fli1:EGFP) zebrafish embryos showing a disturbed PL formation. Embryos were divided in three groups depending on the PL appearance being completely absent, partially formed or completely present. (E) RT-PCR analysis for increased expression of Stab2 in zebrafish driven by mRNA (50 pg) mediated overexpression of HOXC9. (F) Quantification of (E), n = 3 per group. *p<0.05 vs.Orange-mRNA. (G) RT-PCR analysis for reduced expression of Stab2 in zebrafish driven by morpholino (2 ng) mediated silencing of HOXC9. (H) Quantification of (G), n = 4 per group. *p<0.05 vs.Co-Mo. Black scale bar: 500 μm. White scale bar: 50 μm.