
Image
|
Figure Caption
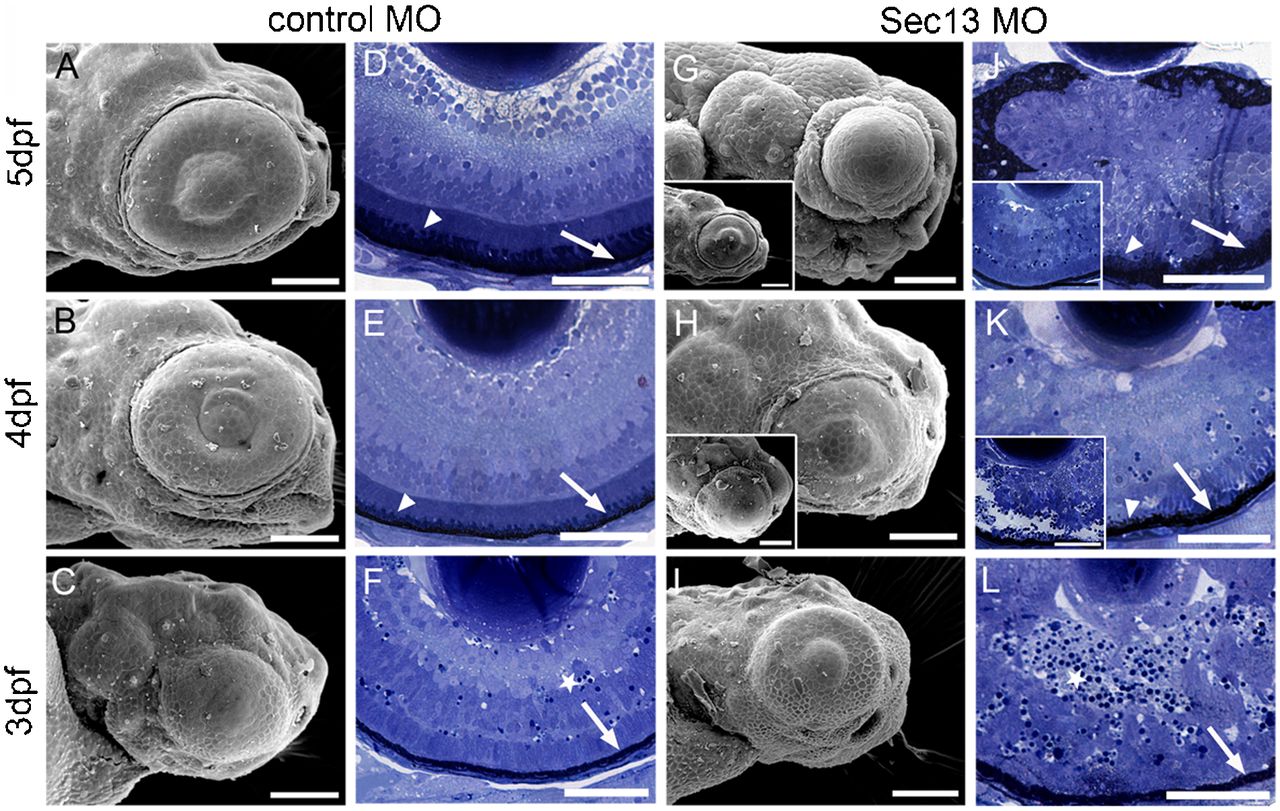
Fig. 1
Sec13 morphant phenotype.
SEM of control (A–C) and Sec13 MO littermates (G–I). Scale bars: 100μm. Toluidine Blue-stained 1μm transversal sections of control (D–F) and Sec13 MO (J–L) from a comparable medial level. Scale bars: 50μm. Insets in G,J,H,K show the other, less representative end of the phenotypic spectrum for 4 and 5dpf, respectively. Arrows: RPE; arrowheads: outer segments of photoreceptors; stars: pyknotic nuclei/cell debris.
Figure Data
Acknowledgments
This image is the copyrighted work of the attributed author or publisher, and
ZFIN has permission only to display this image to its users.
Additional permissions should be obtained from the applicable author or publisher of the image.
Full text @ Biol. Open