
|
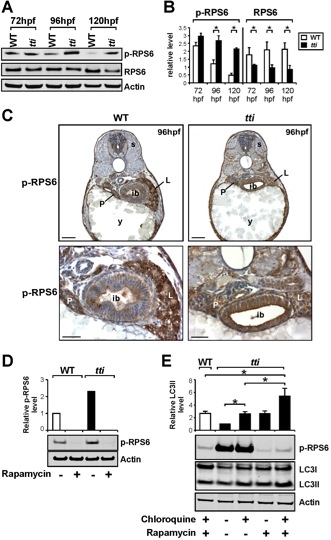
Fig. 7 (A) Western blot analysis of RPS6, p-RPS6 and Actin (loading control) in whole cell lysates of WT and ttis450 larvae between 72–120 hpf. (B) Graphical representation of the data shown in A combined with two additional experiments (each bar represents the mean +/ SD, *p<0.05). ttis450 larvae exhibit increased levels of p-RPS6 at 96–120 hpf and decreased levels of total RPS6 between 72–120 hpf compared to WT siblings. (C) Immunohistochemical analysis of transverse sections of ttis450 and WT larvae at 96 hpf reveals robust p-RPS6 expression in the digestive organs. Scale bars = 50 μM. (D) The persistent expression of p-RPS6 expression in ttis450 larvae at 96 hpf compared to WT is due entirely to up-regulated Torc1 activity as shown by the disappearance of the p-RPS6 signal when larvae are pre-treated with rapamycin. (E) Inhibiting the Tor pathway in ttis450 larvae with rapamycin in the presence of chloroquine reduces p-RPS6 expression and at the same time increases autophagic flux as shown by the increase in LC3II level. In the graphical representation of the data, each bar represents the mean +/ SD (n = 3), *p<0.05.