
Image
|
Figure Caption
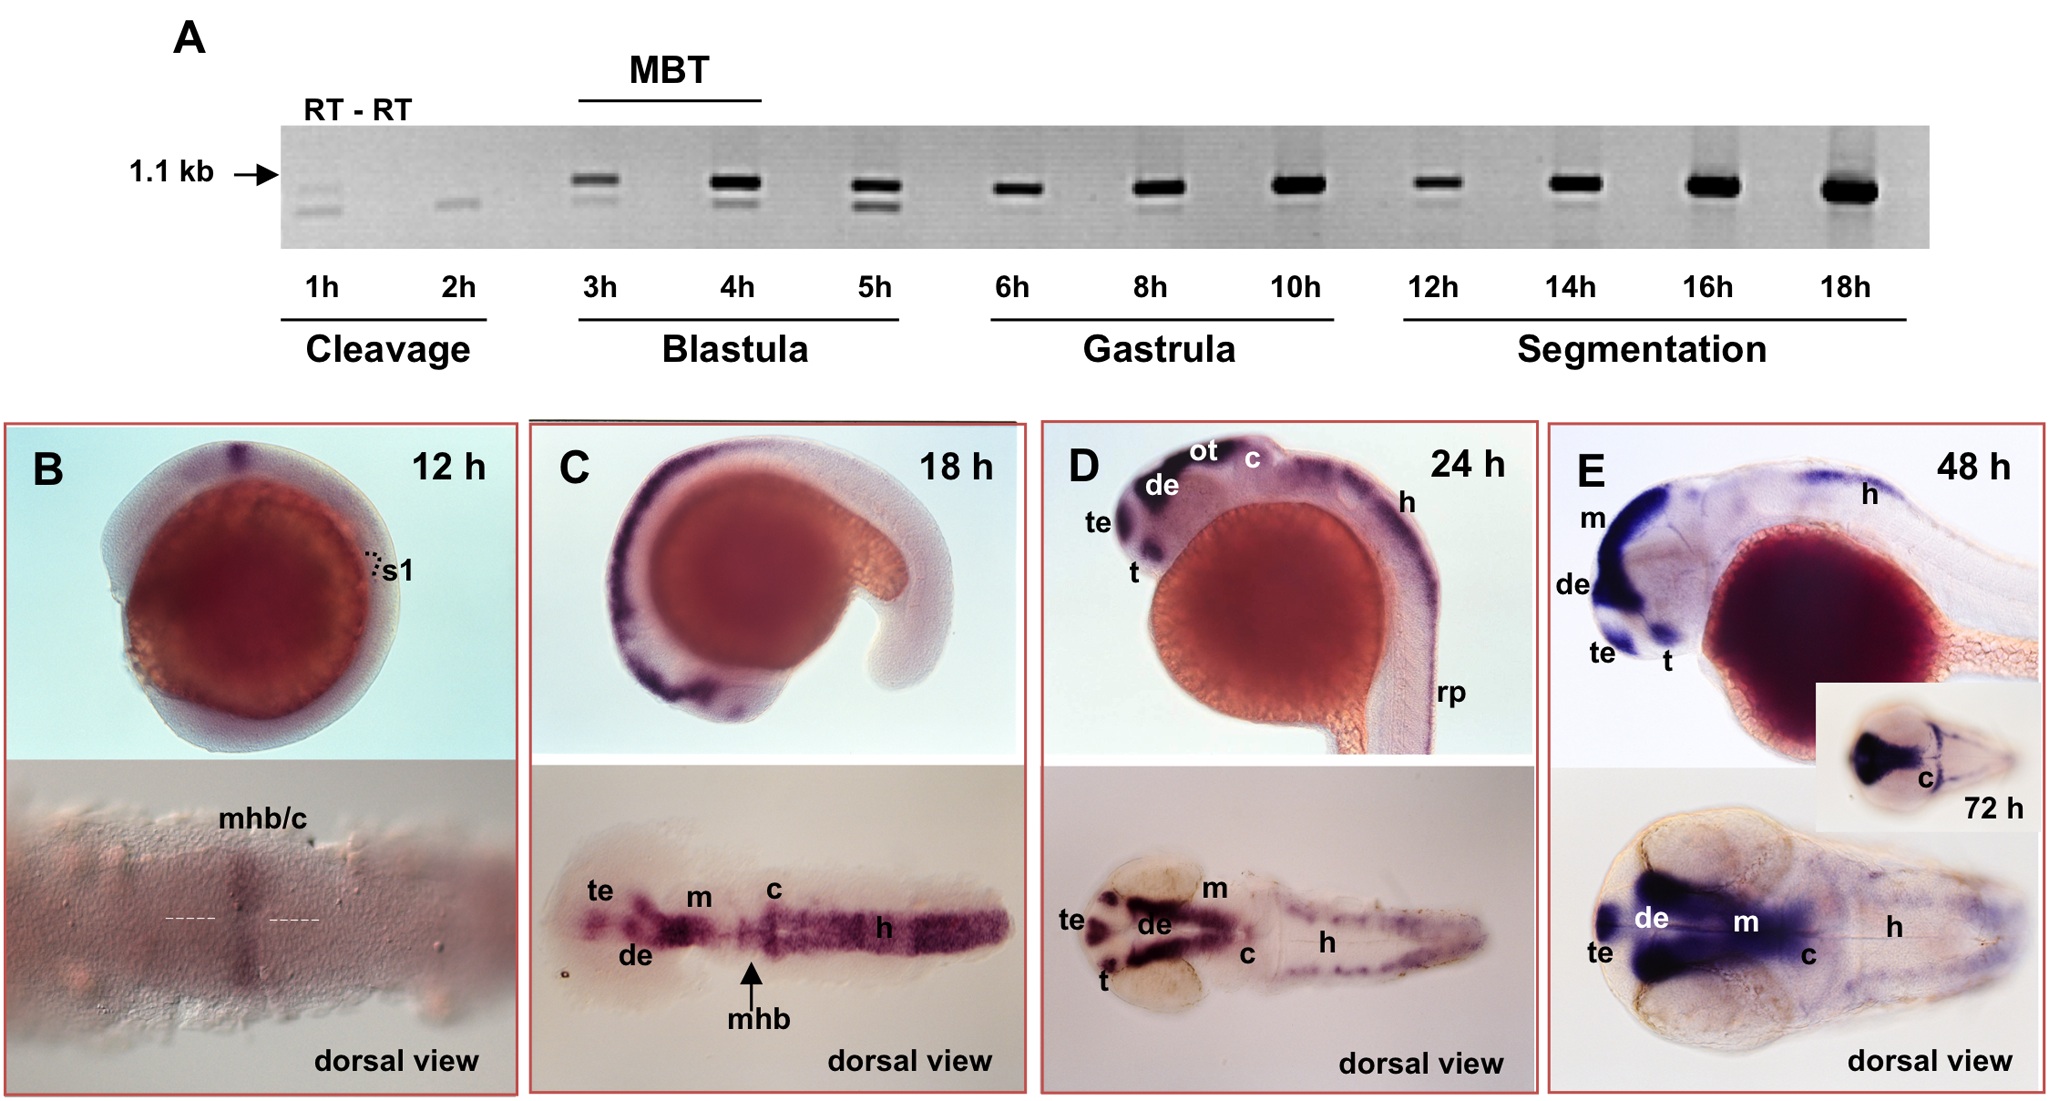
Fig. s2 Expression pattern of zic6. (A), RT-PCR analysis of zic6 expression. Each even line represents negative control (minus RT). MBT, mid-blastula transition. (B–E), Whole-mount in situ hybridization with zic6 RNA probe at different developmental stage. c, cerebellum; de, diencephalon; h, hindbrain; m, midbrain; mhb, midbrain-hindbrain boundary; ot, optic tectum; rp, roof plate; s1, approximate position of the 1st somite; t, thalamus; te, telencephalon.
Acknowledgments
This image is the copyrighted work of the attributed author or publisher, and
ZFIN has permission only to display this image to its users.
Additional permissions should be obtained from the applicable author or publisher of the image.
Full text @ PLoS One