
Fig. 3
- ID
- ZDB-IMAGE-130326-10
- Genes
- Antibodies
- Publication
- Lenhart et al., 2013 - Integration of Nodal and BMP Signals in the Heart Requires FoxH1 to Create Left-Right Differences in Cell Migration Rates That Direct Cardiac Asymmetry
- All Figures
- Figures for Lenhart et al., 2013
|
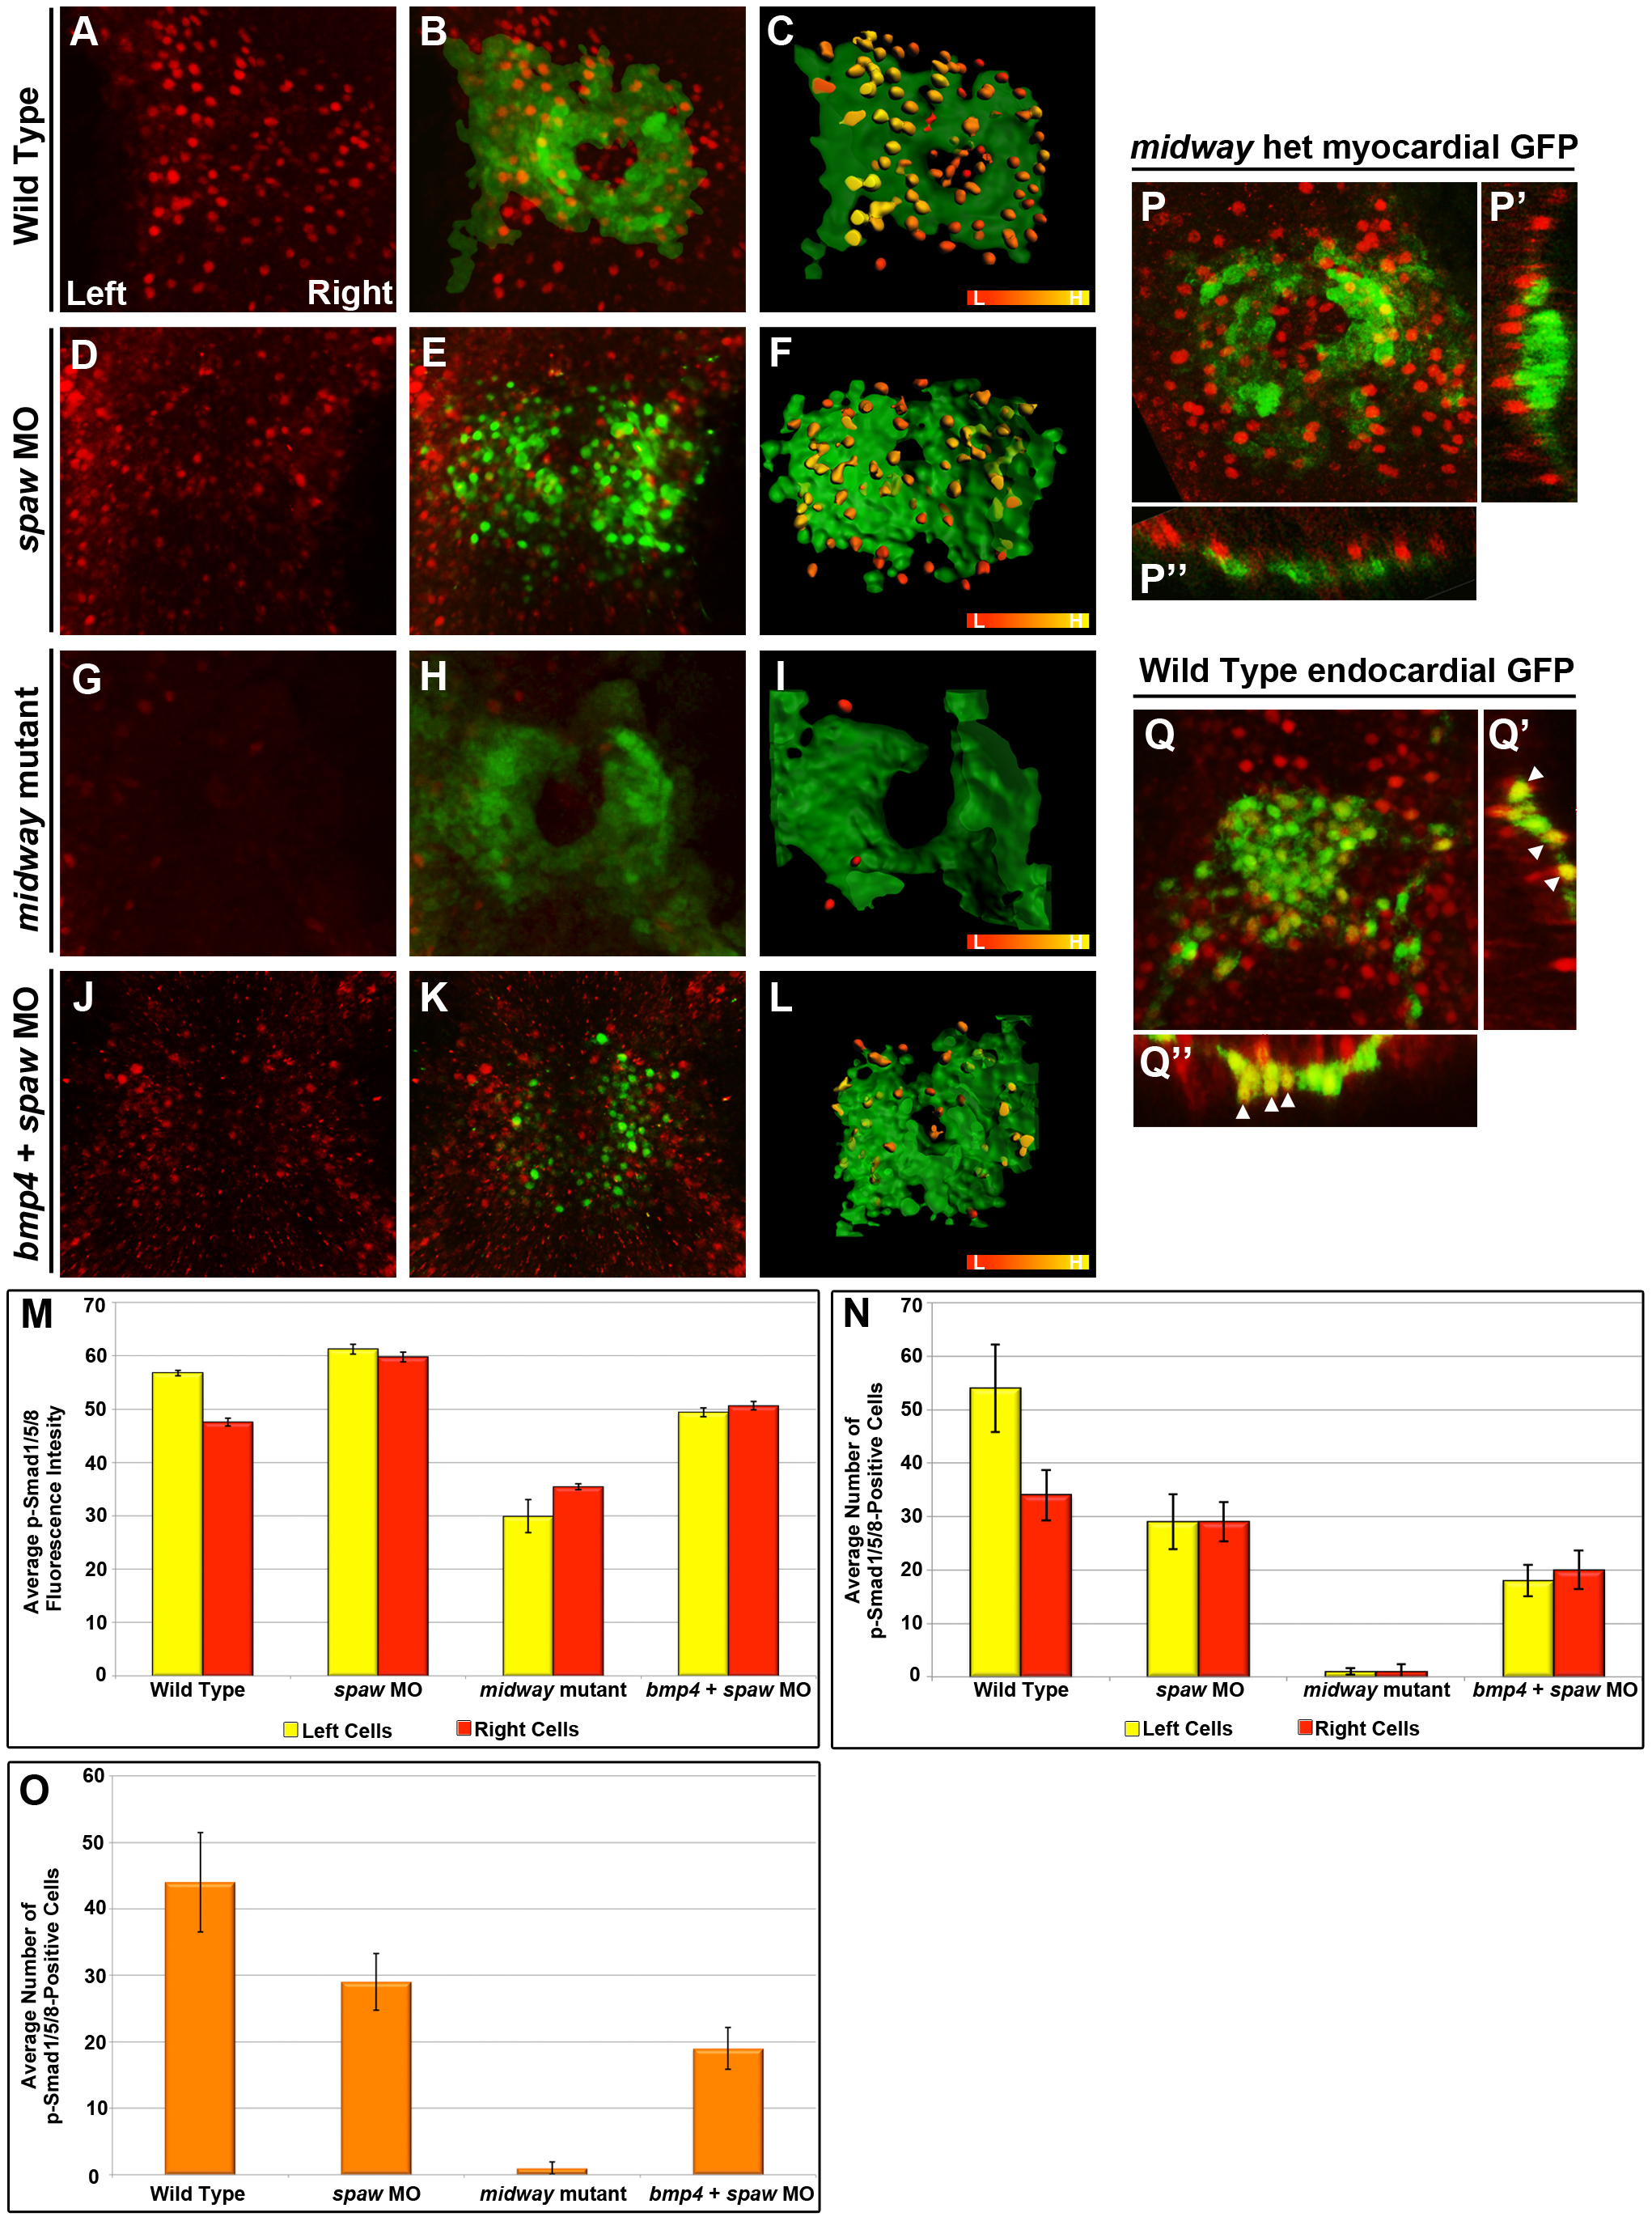
Fig. 3 Quantitation of Bmp pathway activity by average fluorescence intensity and number of p-Smad1/5/8 positive cells.
Immunofluorescence images for activated Smad1/5/8 (A,B,D,E,G,H,J,K,P–P3) in Tg(myl7:eGFP) embryos (myocardial GFP in B,E,H,K,P–P23) or in Tg(kdrl:egfp) embryos (endocardial GFP in Q–Q3). C,F,I,L: Schematics of B, E, H and I using IMARIS surface tool. GFP signal in green; p-Smad1/5/8 positive cells are labeled according to intensity using the red (low) to yellow (high) spectrum ranging from an intensity value of 35–65, respectively. All images are dorsal views except for optical cross sections generated in IMARIS along the anterior/posterior axis (P2, Q2) or across the myocardium (P3, Q3). A–C: p-Smad1/5/8 fluorescence intensity is higher on the left of the WT cardiac cone (n = 6). D–F: p-Smad1/5/8 fluorescence intensity on both sides of the cone in spaw morphants is similar to that observed in cells on the left in WT (n = 6). G–I: midway mutants exhibit reduced fluorescence intensities and numbers of p-Smad1/5/8 positive cells, while p-Smad levels elsewhere in the embryo are seemingly unaffected (data not shown, n = 3). J–L: bmp4 and spaw double morphants exhibit diminished p-Smad1/5/8 compared with WT (n = 6) but not as severe as observed in midway mutants. M: Comparison of the average fluorescence intensities of p-Smad1/5/8 positive cells on the left and right of the cardiac cone. N: Comparison of the average number of p-Smad1/5/8 positive cells on the left and right of the cardiac cone. O: Comparison of the average number of p-Smad1/5/8 positive cells in the entire cardiac field. P–P3: The myocardium shows little to no overlap of p-Smad1/5/8 positive cells (red) with the green of the myocardium. Q–Q3: Conversely, p-Smad1/5/8 (red) is observed to colocalize with the GFP positive endothelial cells in Tg(kdrl:egfp), indicated with arrowheads in Q2 and Q3, indicating that Bmp signals more strongly to the endocardium. Error bars indicate standard error of the mean. L: Low. H: High. MO: Morpholino. Het: heterozygote.