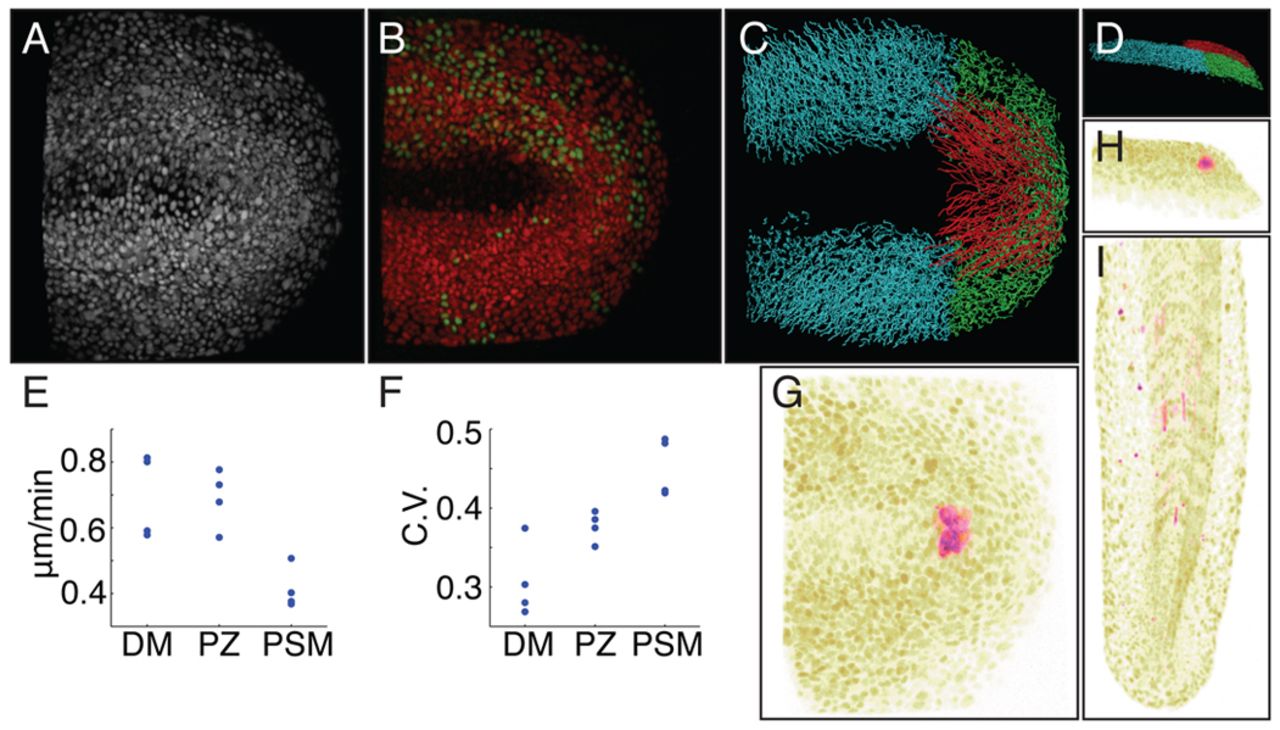
Fig. 1 Cell movement in the wild-type zebrafish tailbud. (A) Confocal image stacks of RFP-labeled nuclei were taken through time and nuclei were tracked in 4D. (B) Independent tracking of red and green double-labeled nuclei revealed cell tracking to be 85% accurate. (C) Cell tracks were divided into regions of interest: dorsal medial zone (DM; red), progenitor zone, (PZ; green), presomitic mesoderm (PSM; cyan). (D) A lateral view of the image shown in C. (E) Examination of mean track speeds. P-values calculated using ANOVA with additional validation by permutation tests. The DM and PZ speeds are equivalent (DM vs PZ, P>0.05) and are higher than PSM (DM vs PSM, P<0.05; PZ vs PSM, P<0.05). (F) The means of the coefficient of variation (CV) of track speed show that the CV increases from the DM to PZ (P<0.05) and from the PZ to PSM (P<0.05). (G-I) Two-photon labeling of DM cells at the ten-somite stage. (G) Dorsal view. (H) Lateral view. (I) After completing elongation, the uncaged cells differentiated as myofibers. A-C and G are dorsal views. In all panels, anterior is left the right except panel I in which anterior is up.
Image
Figure Caption
Acknowledgments
This image is the copyrighted work of the attributed author or publisher, and
ZFIN has permission only to display this image to its users.
Additional permissions should be obtained from the applicable author or publisher of the image.
Full text @ Development

