
Image
|
Figure Caption
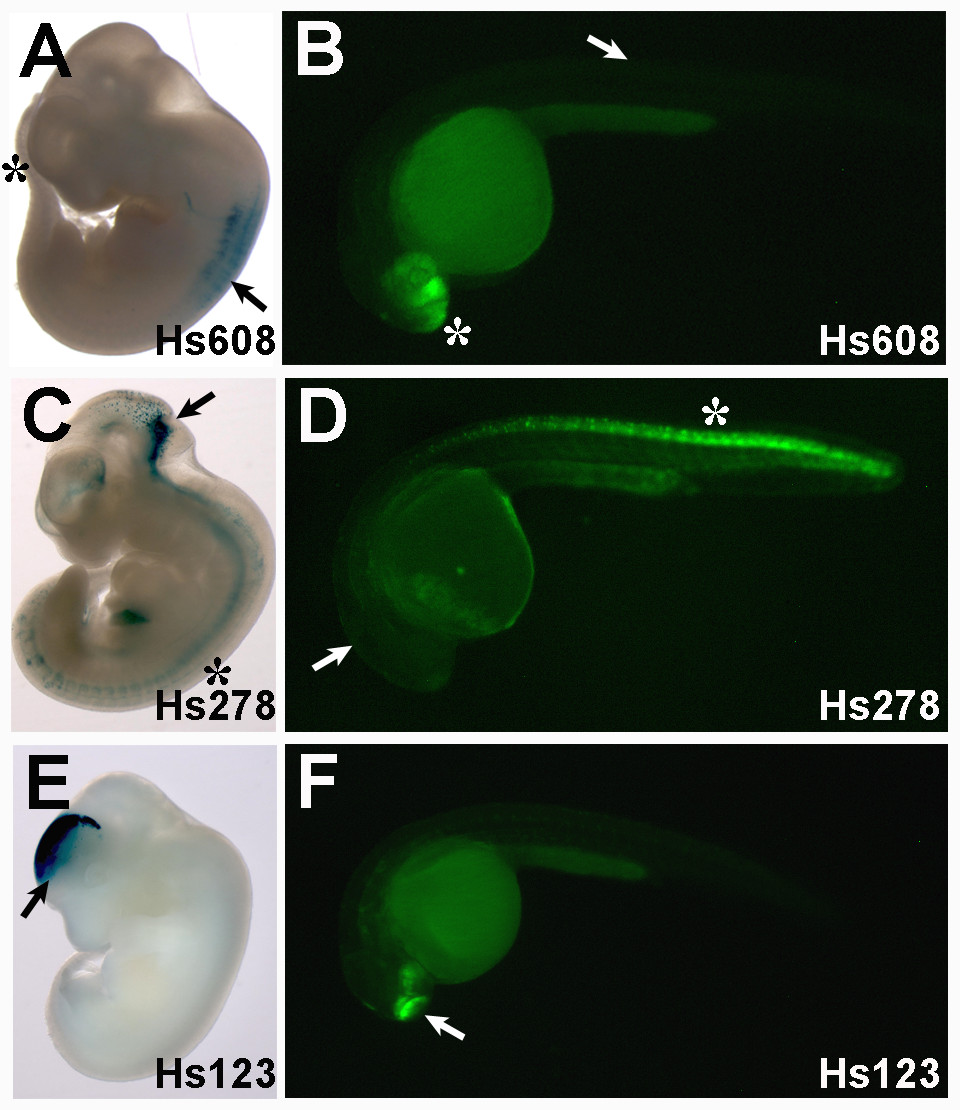
Fig. 2 Comparison of enhancer activity of different CNEs in mice and zebrafish. A, B) Expression driven by the Hs608 enhancer shows mouse-specific expression (A) in the dorsal root ganglia and spinal cord (arrow), and zebrafish-specific expression (B) in the forebrain (asterisk). C, D) The Hs278 enhancer drives expression in hindbrain (arrow) and spinal cord (asterisk) in mouse (C) but only in spinal cord in zebrafish embryos (D). E, F) The Hs123 enhancer drives similar expression in the forebrain of mouse (E) and zebrafish (F, arrow).
Acknowledgments
This image is the copyrighted work of the attributed author or publisher, and
ZFIN has permission only to display this image to its users.
Additional permissions should be obtained from the applicable author or publisher of the image.
Full text @ BMC Genomics