
|
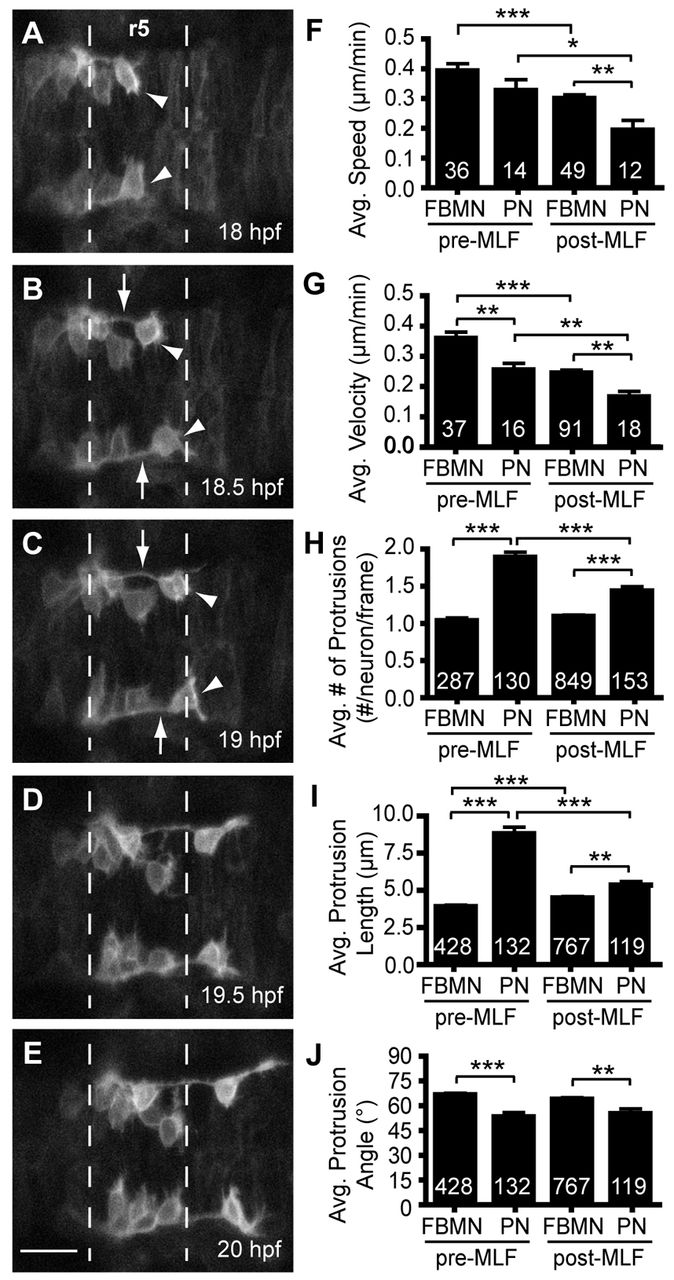
Fig. 4 The pioneer neuron behaves differently than follower FBMNs. (A-E) Still images from time-lapse imaging of Tg(zCREST1:membRFP) embryos from 18-22 hpf shown at 30-minute intervals. Arrowheads indicate the pioneer neuron and arrows indicate the trailing axon of the pioneer neuron. (F-J) Analysis of pioneer and follower FBMN behavior before (pre-MLF) and after (post-MLF) the MLF has entered the hindbrain region. (F) Average speed of migration. (G) Average posterior velocity. (H) Average number of protrusions per neuron per 5-minute time point. (I) Average length of protrusions per 5-minute time point. (J) Average angle of protrusions, where 0° is towards the posterior in the direction of migration and 90° is towards the midline. Error bars indicate s.e.m. Significance values: *P<0.05, **P<0.01, ***P<0.001. Scale bar: 20 μm.