
Fig. 4
- ID
- ZDB-IMAGE-130320-13
- Genes
- Antibodies
- Publication
- Banerjee et al., 2013 - A Novel Role for Lh3 Dependent ECM Modifications during Neural Crest Cell Migration in Zebrafish
- All Figures
- Figures for Banerjee et al., 2013
|
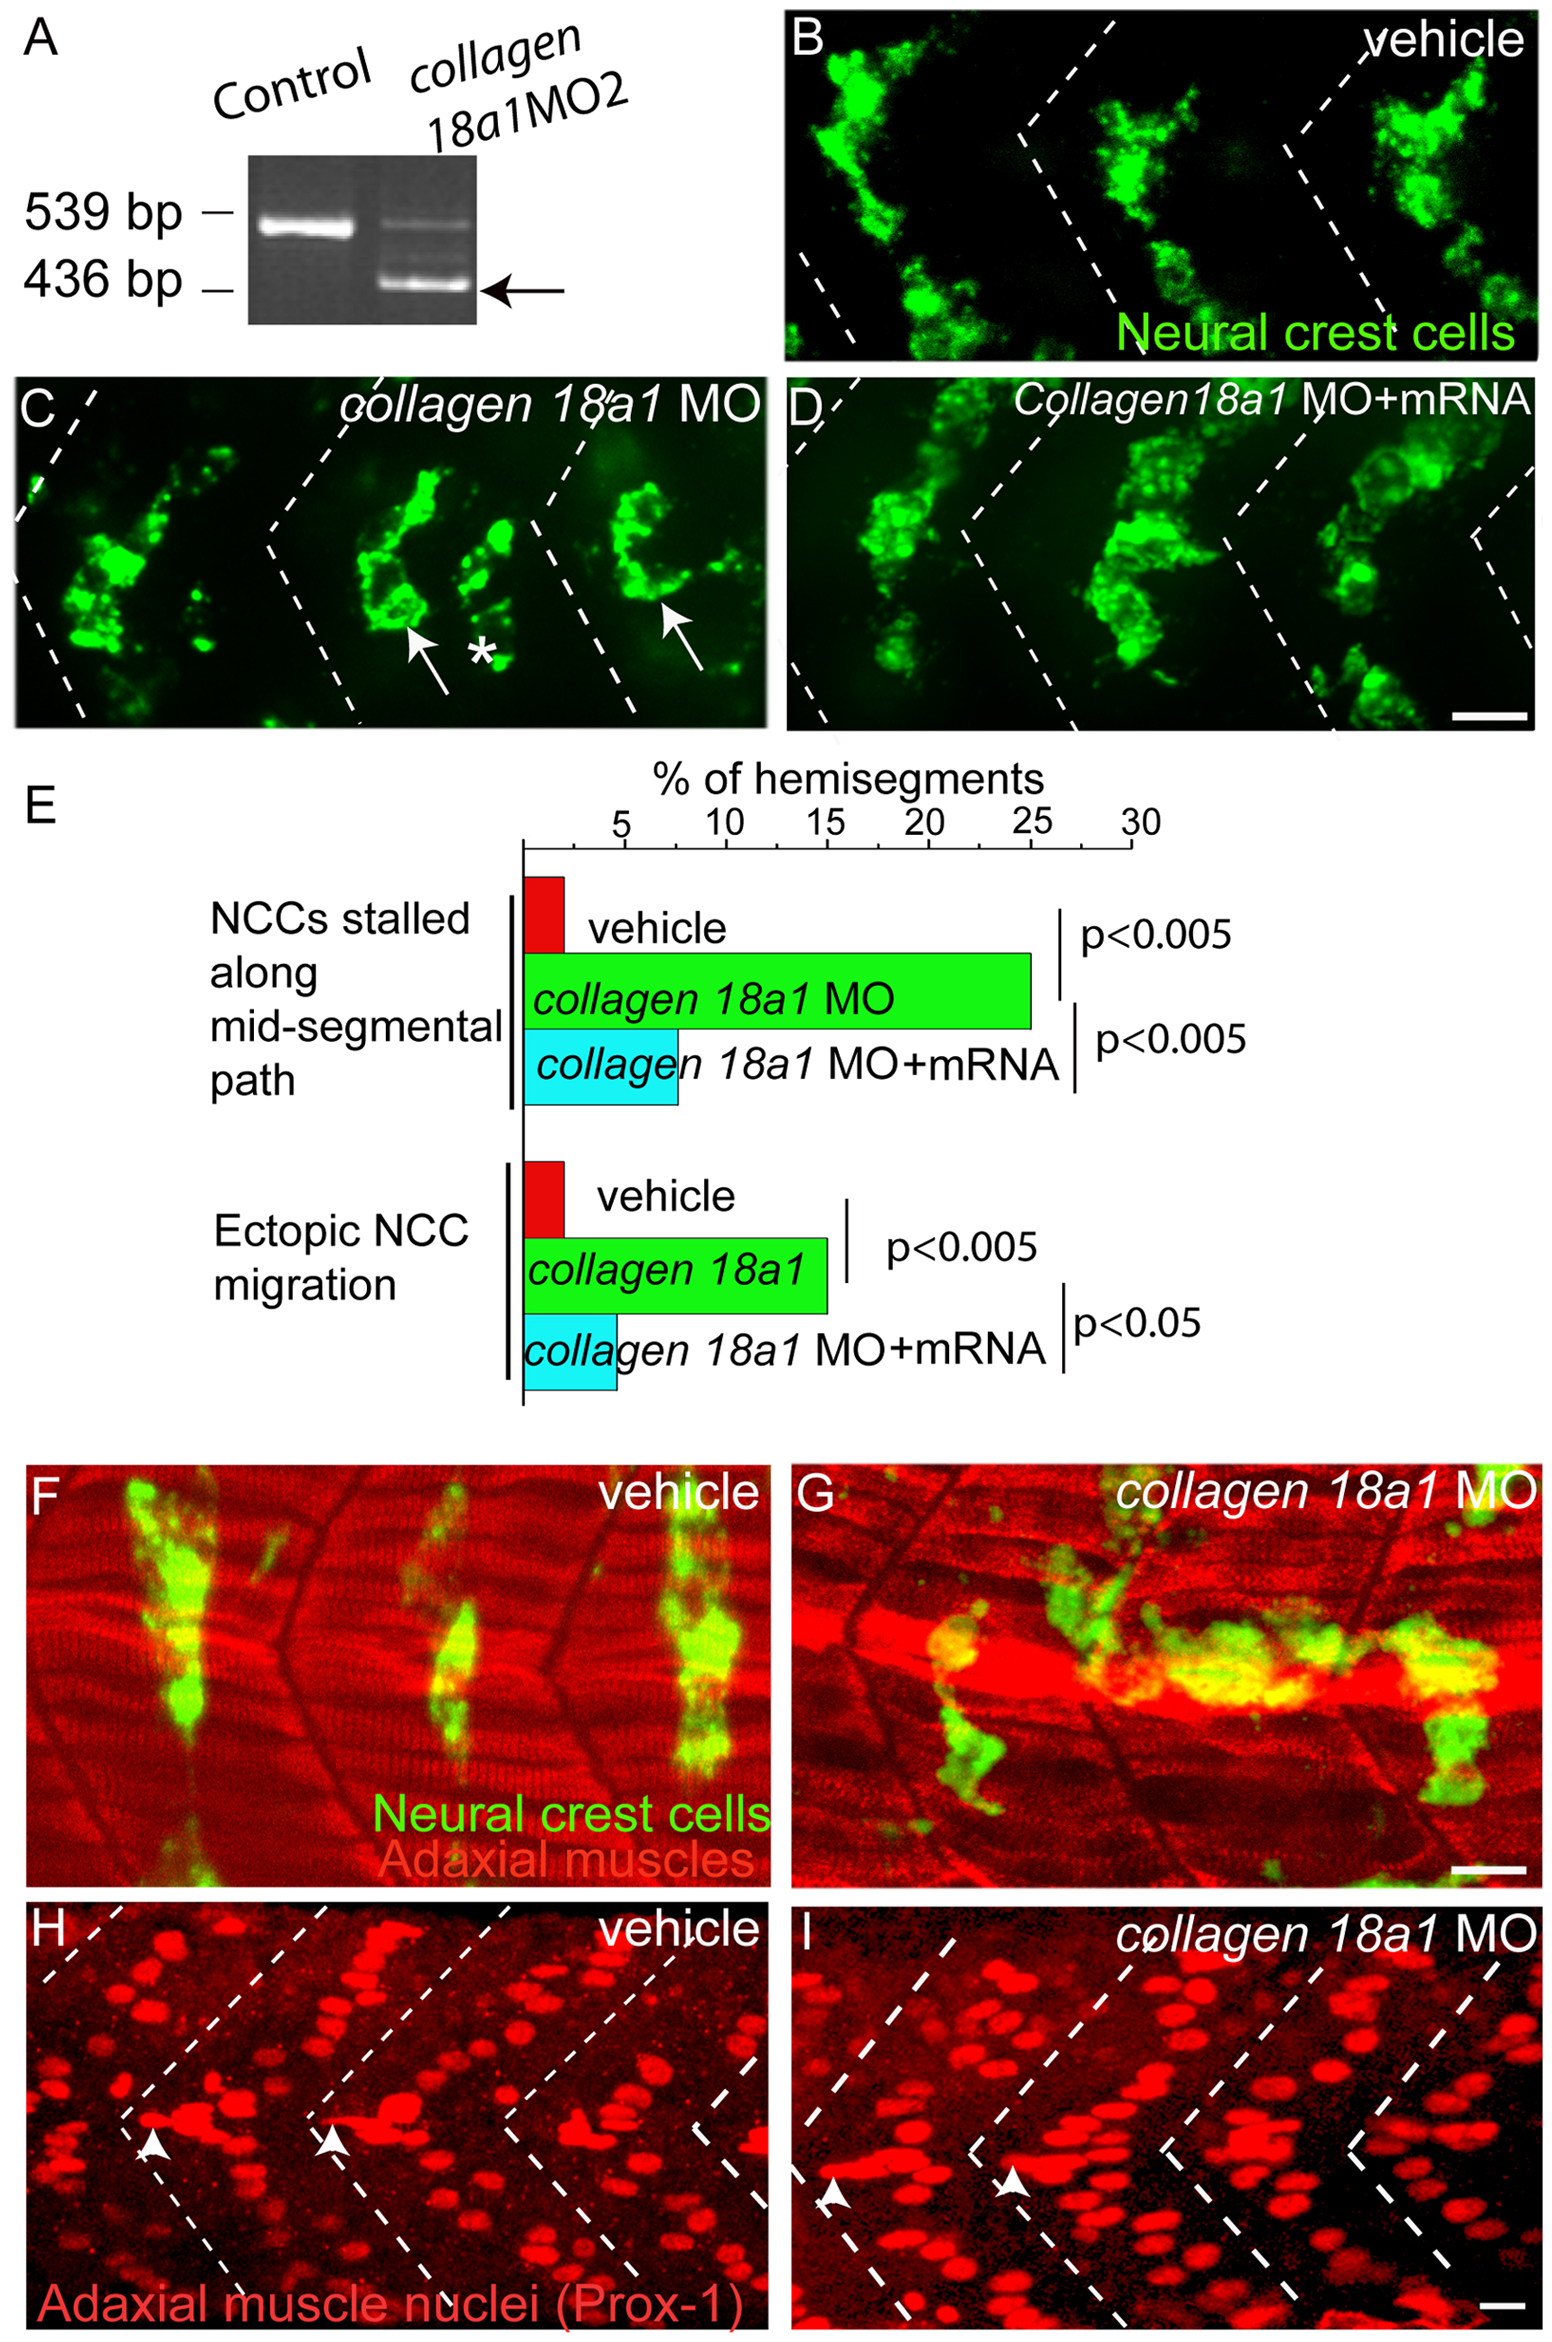
Fig. 4 Knockdown of collagen18a1 results in neural crest cell migration defects.
(A) RT PCR analysis showing efficiency of collagen18a1 knockdown following morpholino treatment. Arrow marks the expected band following morpholino treatment sized at 439 base pairs. Lateral views of 28 hpf vehicle (B) collagen18a1 MO (C) and collagen18a1 MO plus collagen18a1 mRNA injected embryo (D), stained with crestin to visualize neural crest cells. Arrows indicate neural crest cells stalled along the mid-segmental path (C), and asterisks indicate neural crest cells along the ectopic path. (C, E) (E) Quantification of neural crest cell migration defects in collagen18a1 MO injected embryos. p values were calculated using one tailed Fisher Exact Probability test. Vehicle injected and collagen18a1(G) MO injected embryos, stained with F59 to visualize adaxial cells (red), and crestin to visualize neural crest cells (green) (F–G) and with prox-1 antibody (H–I). Arrowheads mark adaxial cell nuclei located anteriorly near horizontal myoseptum region (H–I). Scale bar-10 micron.