
|
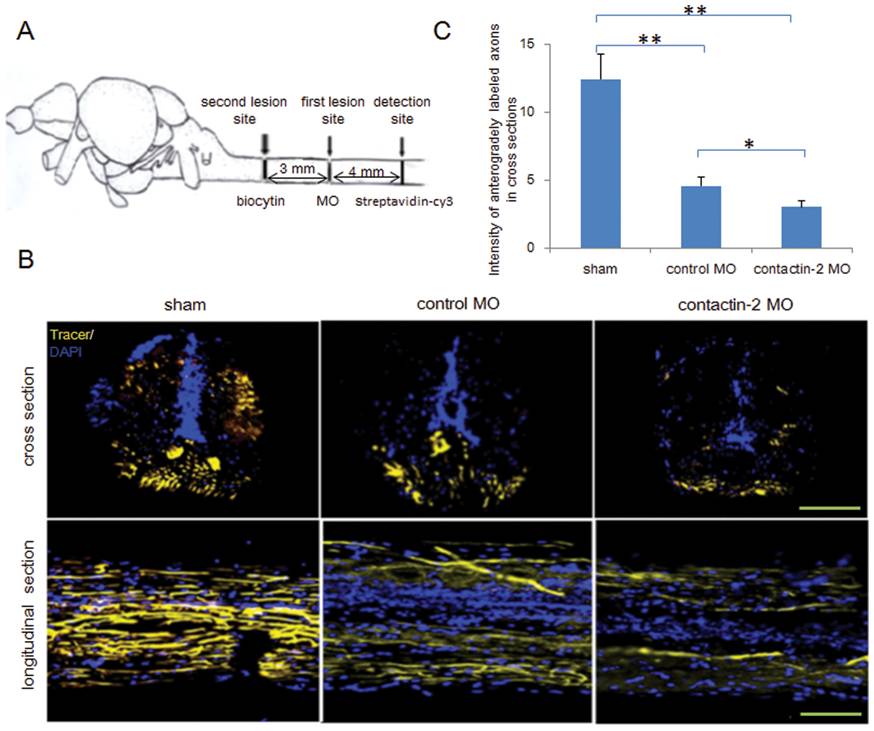
Fig. 5 Reduction of contactin-2 protein expression after spinal cord injury impairs regrowth of axons.
(A) Schematic illustration for anterograde tracing. Biocytin was applied at the site symbolized by the second lesion site at 6 weeks after the first lesion. After 24 hrs, biocytin was detected at the site 4 mm distal to the first lesion site by Streptavidin-Cy3. (B) Cross and longitudinal sections show axons regrown beyond the first lesion site. (C) Relative fluorescence intensity for cross sections was quantified by ImageJ software. A 34% decrease in intensity was observed in the contactin-2 anti-sense MO treated group compared to the control MO treated group (*p<0.05, **p<0.01, t-test; n = 3 fish/group). The sham injury group shows similar intensities as the non-injury group. Scale bars, 200 μm.