
|
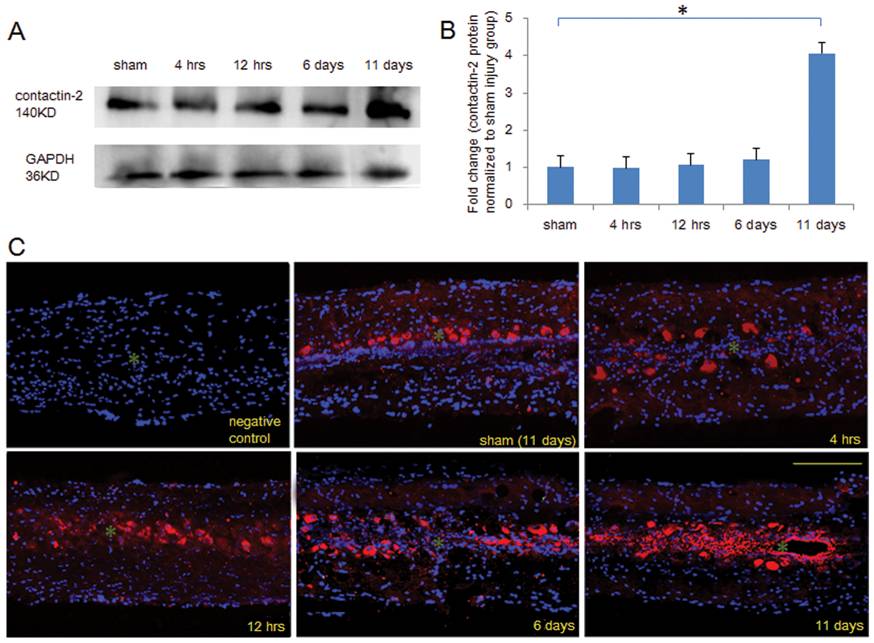
Fig. 2 Time course of contactin-2 protein expression after spinal cord injury.
(A) Western blot analysis shows contactin-2 protein expression in the spinal cord caudal to the lesion site at four time points after SCI. Significant upregulation was detected at 11 days after SCI compared to the sham injury group at 11 days. (B) The intensity of bands as quantified by ImageJ software and fold change compared with the sham injury group shows an increase in contactin-2 protein level that achieved significance at 11 days after SCI (*p<0.05, one-way ANOVA with Tukey’s post-hoc test; n = 5 fish/group). Values represent means+SEM. (C) Contactin-2 expression in the spinal cord 3 mm caudal to the lesion site was examined by immunofluorescence in longitudinal sections at 4 and 12 hrs, and at 6 and 11 days after SCI. Upregulation of contactin-2 was mainly observed along the central canal at 11 days after SCI. Negative control (without primary antibody), contactin-2 (red), DAPI (blue). * indicates the central canal. Scale bar, 200 μm.