
Image
|
Figure Caption
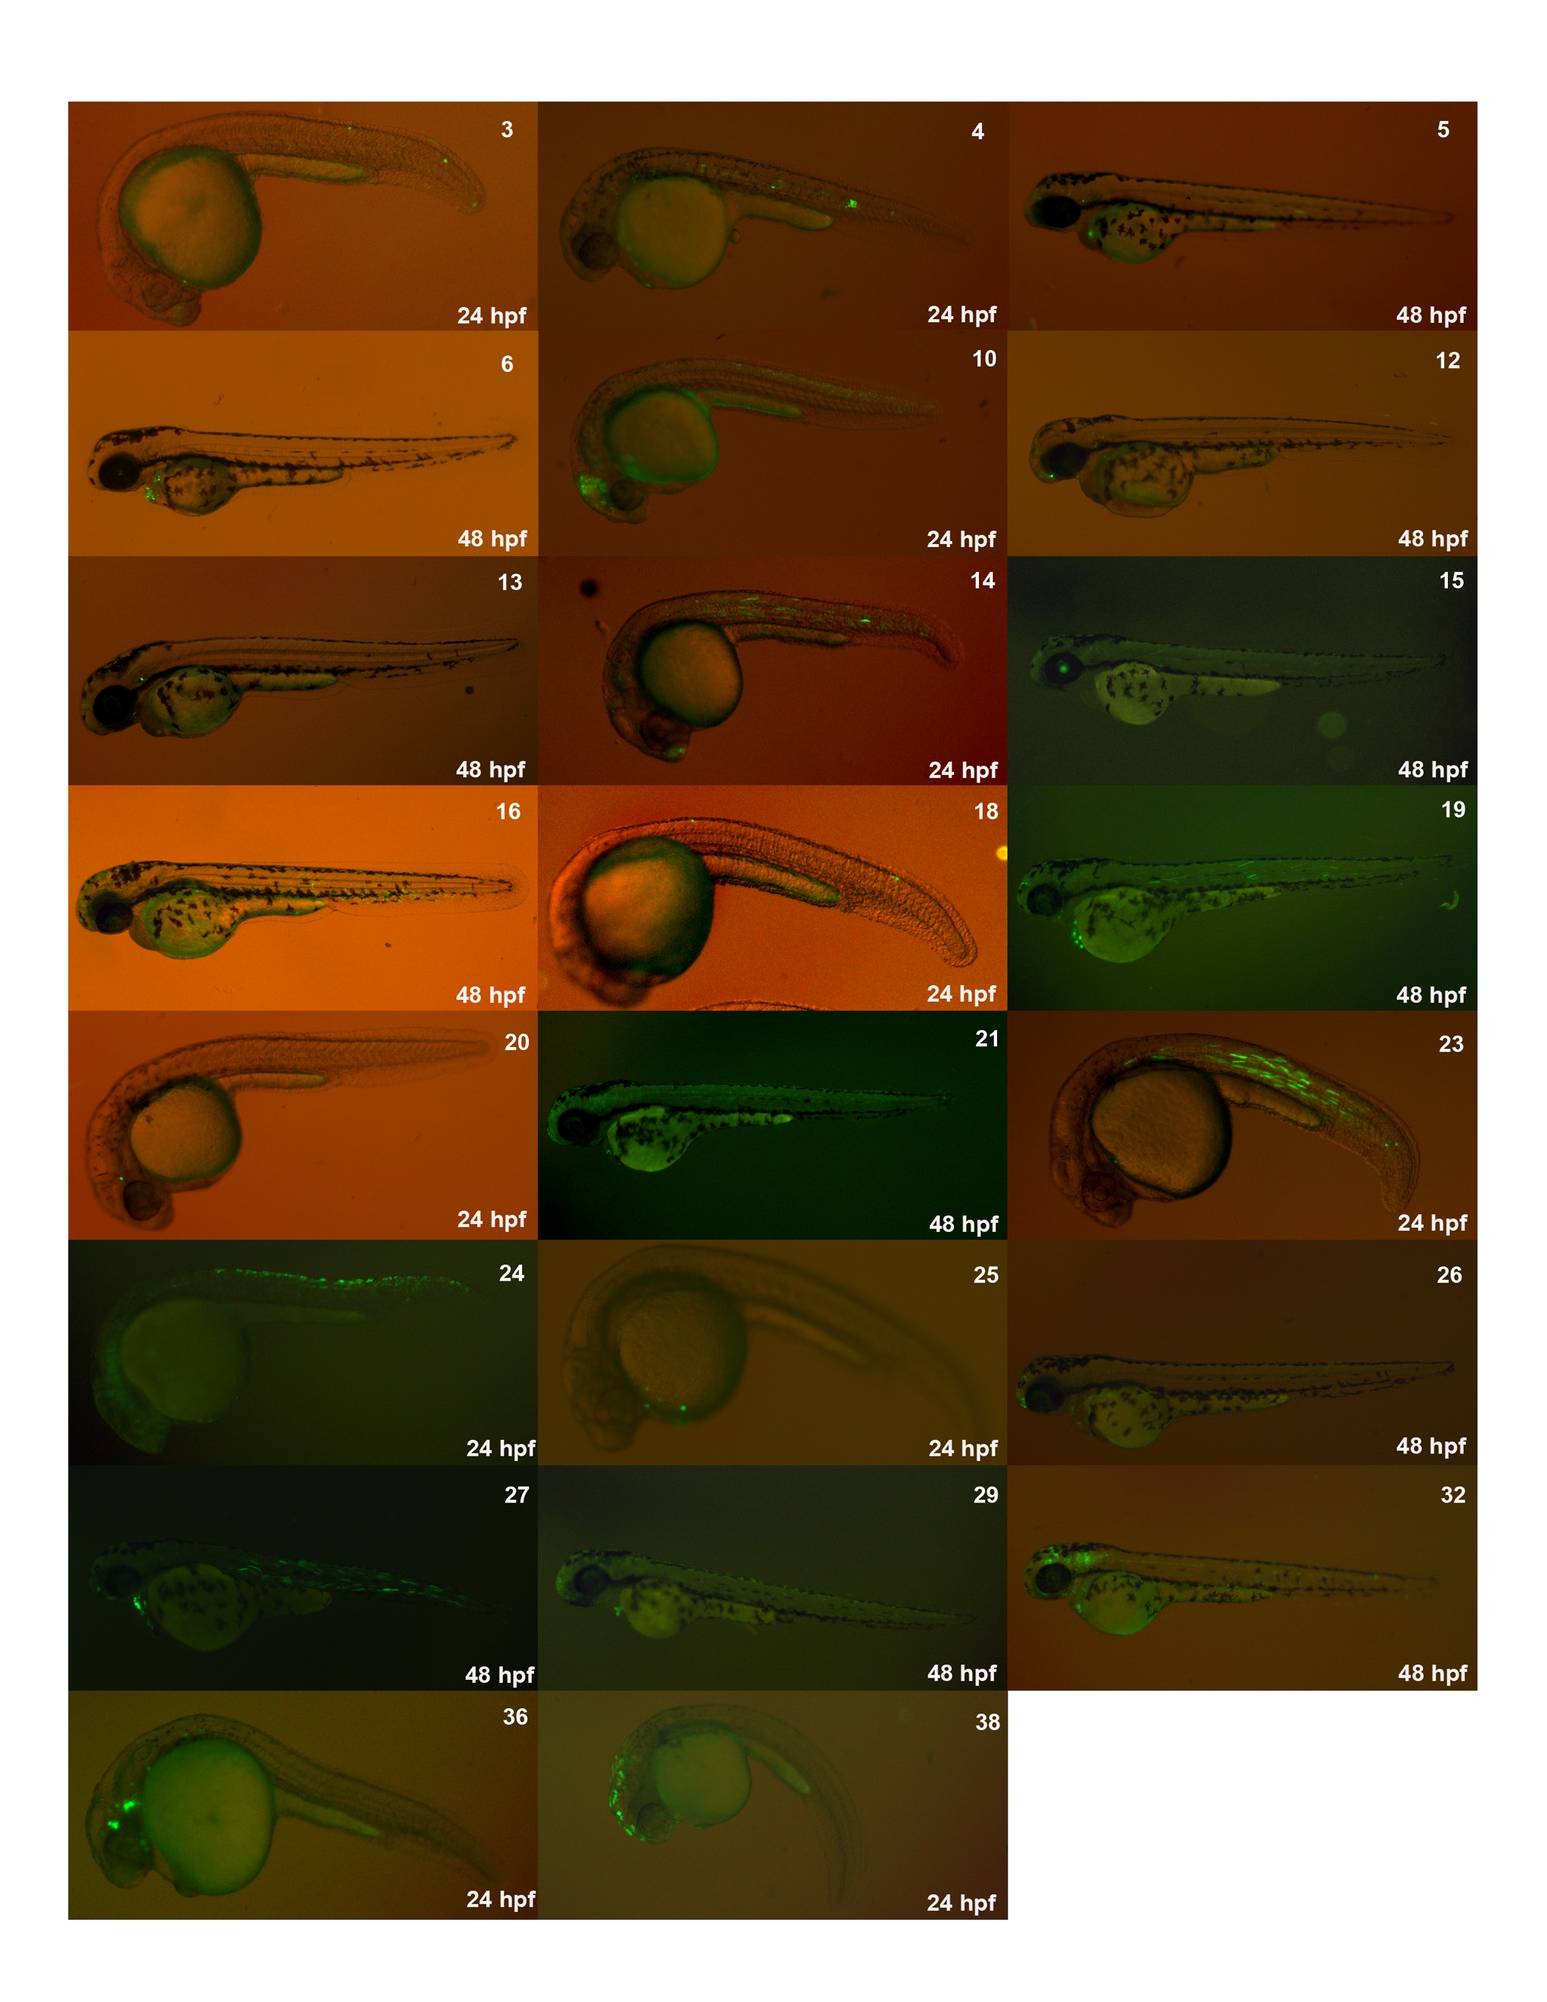
Fig. S4 AUTS2 enhancer candidates (AECs) positive for enhancer activity in zebrafish. A representative fish of each positive AEC enhancer is shown. The number in the top right of every image is the AEC number and the hours post fertilization (hpf) when the picture was taken is indicated in the bottom right. Their tissue-specific expression pattern is denoted in Table S1 and http://zen.ucsf.edu.
Acknowledgments
This image is the copyrighted work of the attributed author or publisher, and
ZFIN has permission only to display this image to its users.
Additional permissions should be obtained from the applicable author or publisher of the image.
Full text @ PLoS Genet.