
|
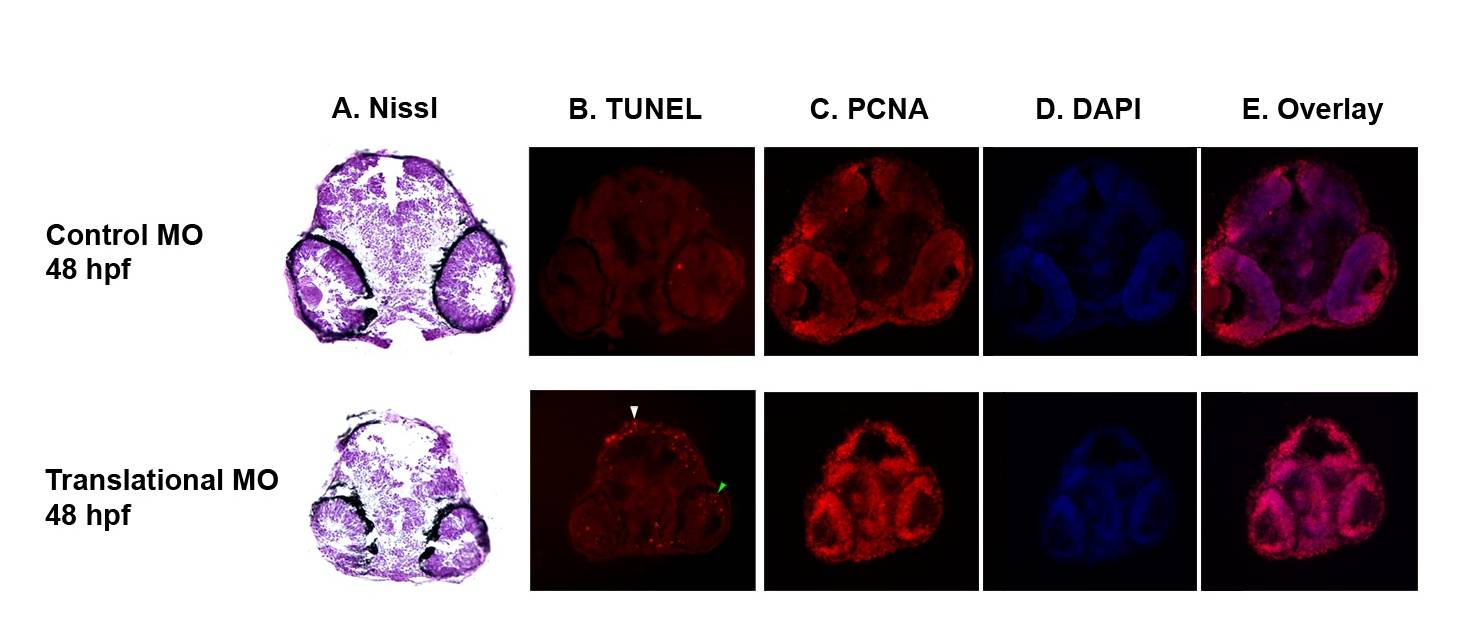
Fig. S2 Histological phenotype of auts2 morphants (A) Nissl staining shows a reduction in neuron territory, primarily in the midbrain, of fish injected with the translational MO compared to 5 bp mismatch controls at 48 hpf. (B) TUNEL stained sections show fewer apoptotic cells in the optic tectum (white arrowhead) and the retina (green arrowhead) in 48 hpf auts2 morphants versus the 5 bp translational MO mismatch control. (C–E) Coronal sections stained with PCNA, DAPI and overlays show an increase in cell proliferation in the translational morphant fish compared to the 5 bp mismatch control in the mesencephalon, diencephalon and retina.