
|
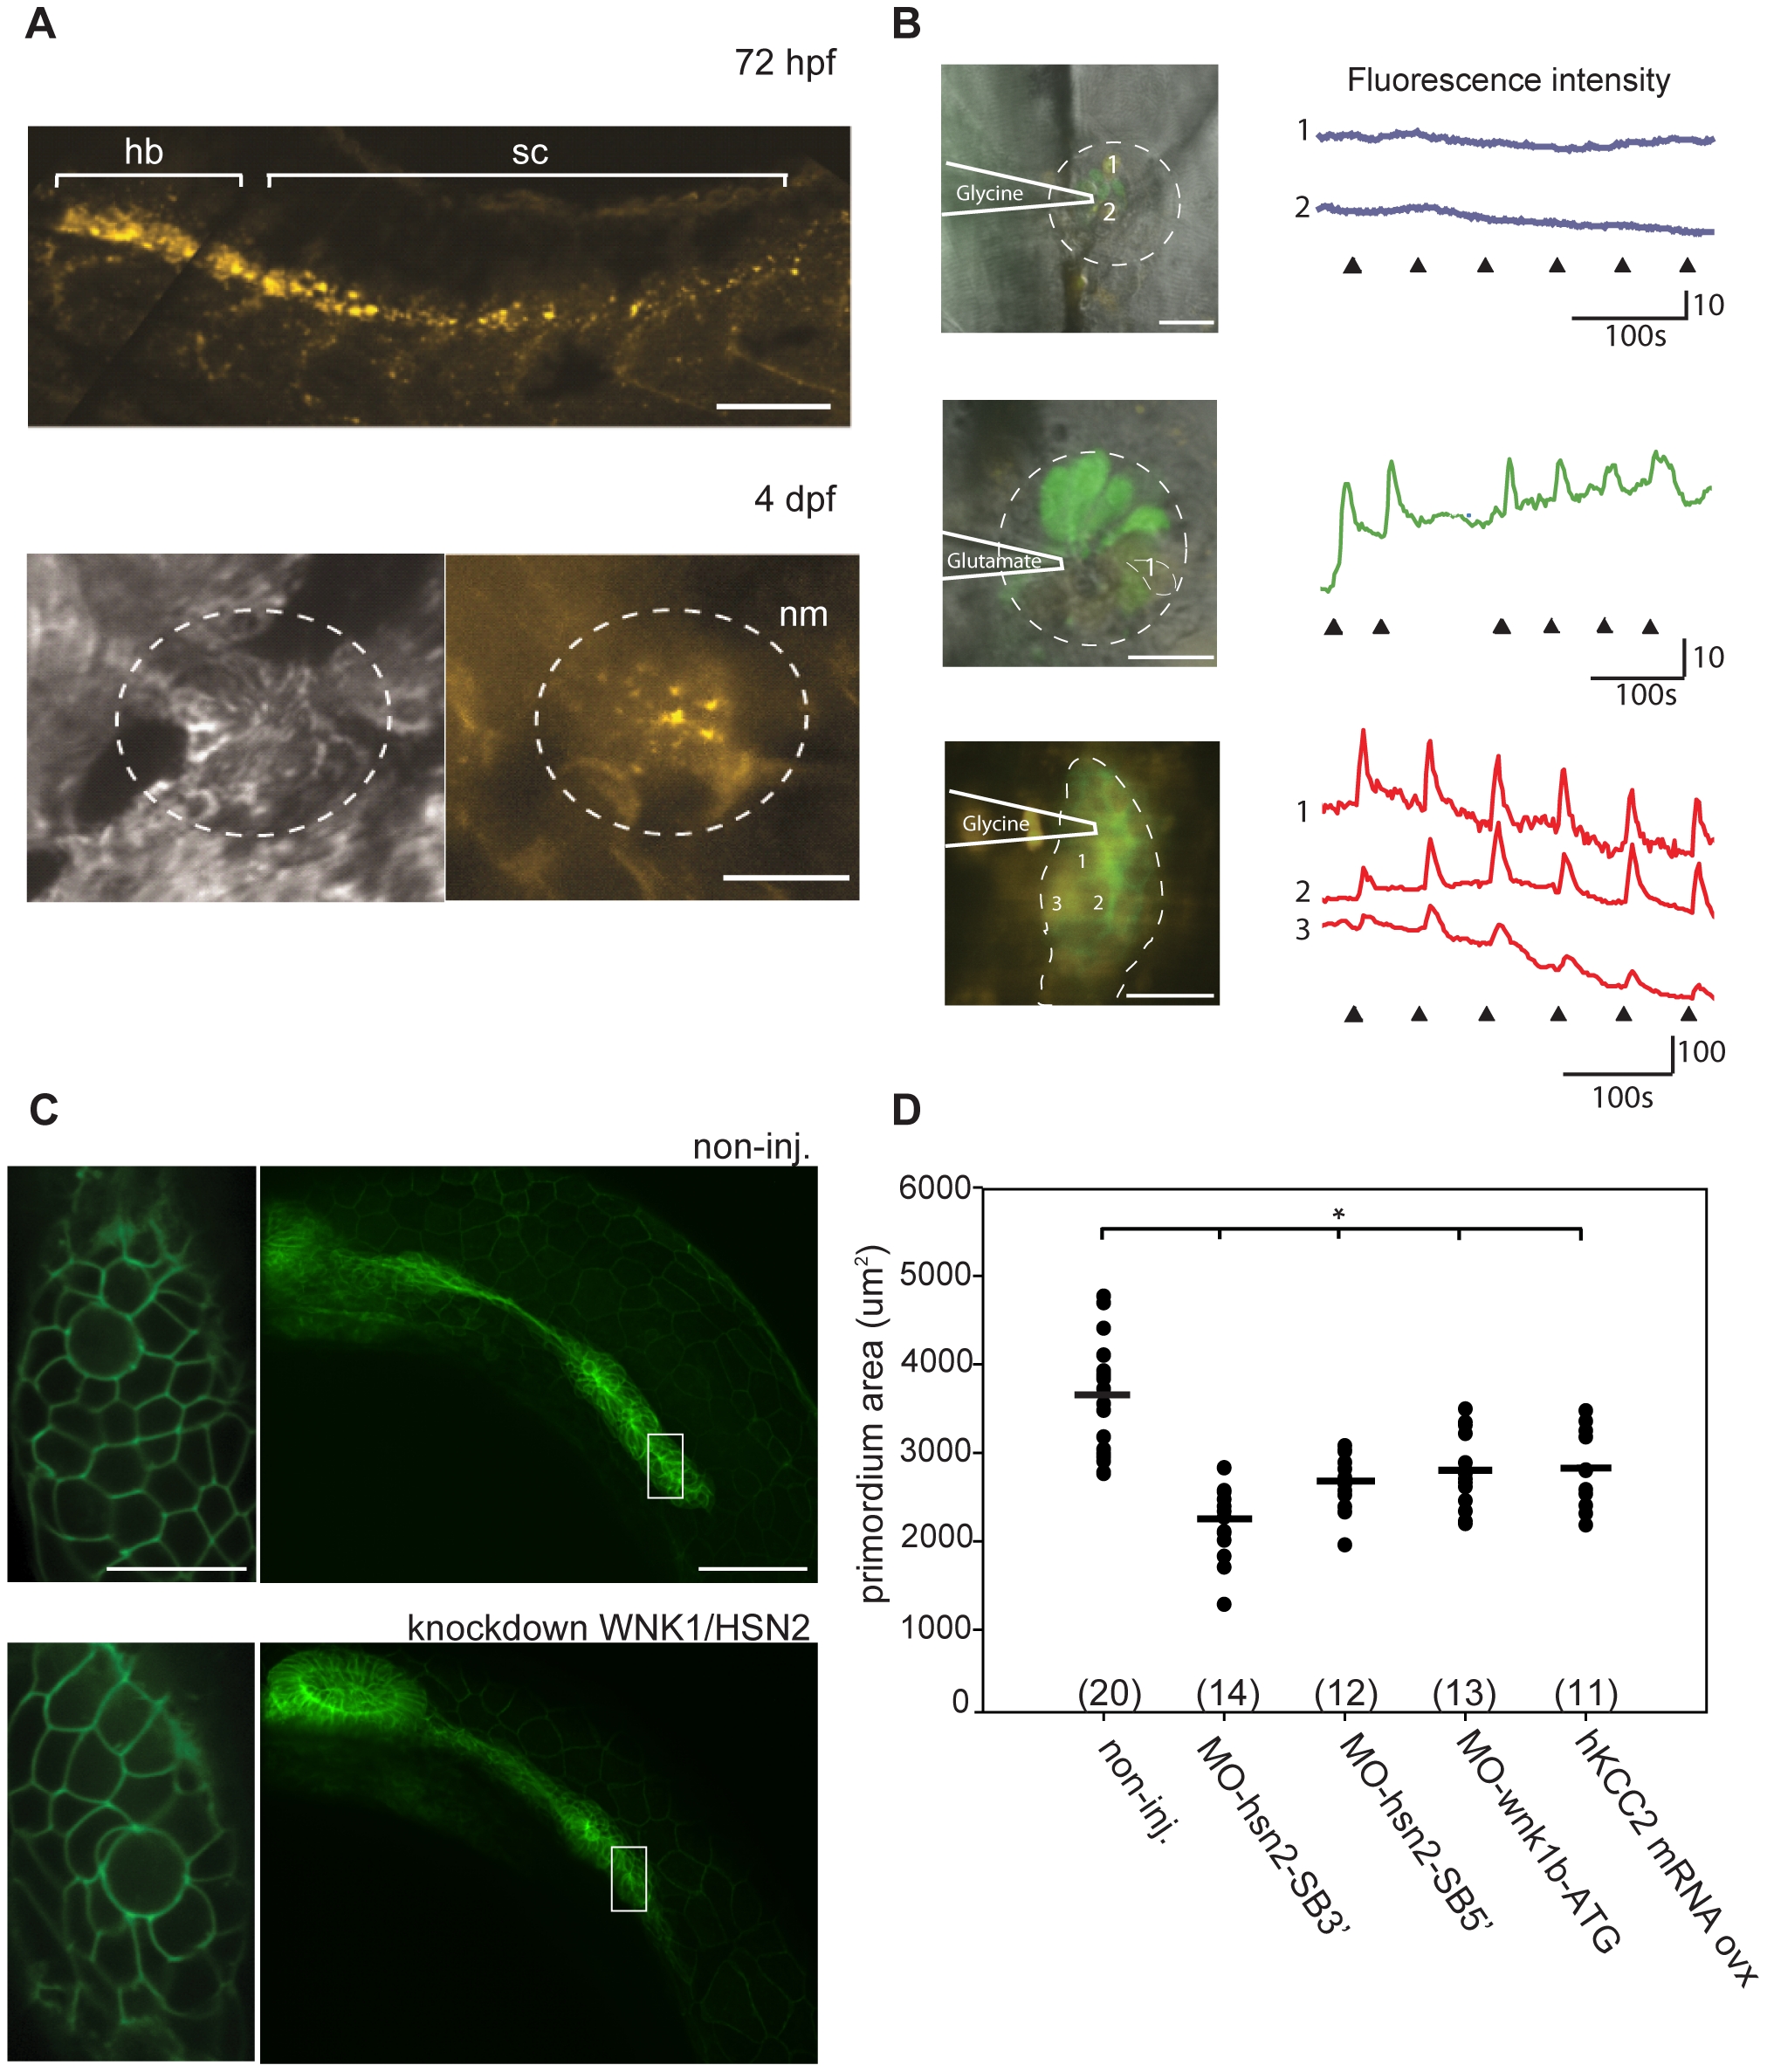
Fig. 5
KCC2 is found in the embryonic zebrafish PLL.
A) Presence of kcc2 in the zebrafish embryo was assessed by in situ hybridization against slc12a5 and reveals staining in the hindbrain (hb) and spinal cord (sc) at 72hpf as well as staining in hair cells of a PLL neuromast (nm) at 4dpf. B) Neuromasts of 4 dpf transgenic Tg(NBT:MAPT-GFP) embryos expressing GFP (green) under neuron-specific beta-tubulin promoter (left upper and middle images) and primordium of a 2dpf transgenic Tg(-8.0cldnb:lynEGFP) embryos expressing GFP under the claudin-b promoter in the membranes of cells composing the primordium (left lower image) were labeled with the Ca2+ indicator Rhod 2-AM (deep red) to show that ionophoresis of glycine failed to evoke Ca2+ transients in 3–4 dpf neuromasts (right black upper traces) but did so in primordium cells (right red bottom traces). In contrast, neuromasts of embryos of equivalent stage respond to glutamate (right, green middle trace). The dashed line illustrates the primordium or neuromast region and the heavy lines illustrates the position of the pipet. C)Transgenic embryos expressing GFP under the claudin-b promoter, which labels the membranes of cells composing the primordium, were used to observe the size of this migrating group of PLL neuromast progenitors for both non-injected and WNK1/HSN2 knockdown embryos. Close-up image of the primordium cells shows no difference in organization between non-injected and WNK1/HSN2 knockdown embryos. D) The primordium area was measured on one side of the embryos and data was tabulated in a scatter plot which shows that WNK1/HSN2 embryos, as well as embryos overexpressing human KCC2, have a significantly smaller primordium area than non-injected embryos. The number of primordial measured is indicated in parenthesis at the bottom of the graph. The knockdown embryo presented in (C) is a representative results at 22hpf obtained from MO-wnk1-ATG injection. Scale bars: (A) 100μm and 20μm for neuromast image, (B)20μm, (C) 80μm for full primordium and 20μm for cell close-up.