
|
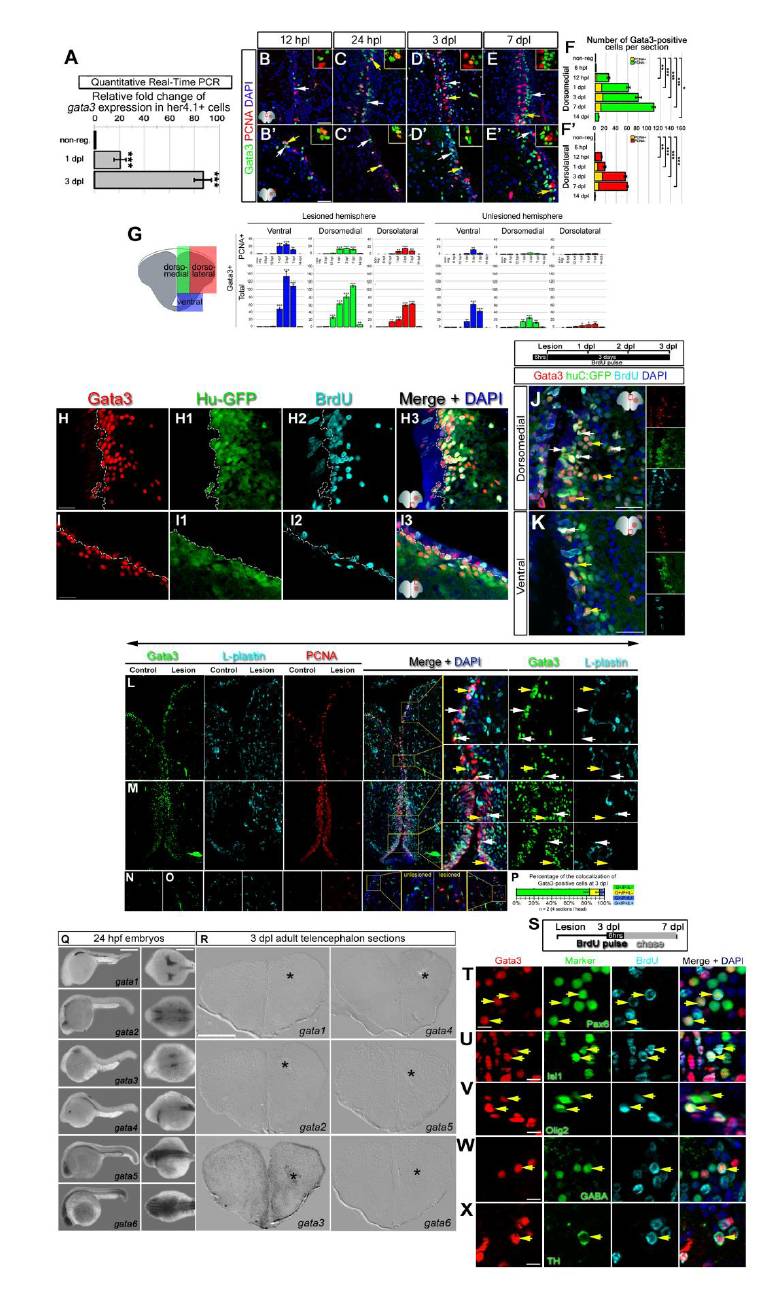
Fig. S1 (A) gata3 is significantly upregulated after the injury in her4.1:GFP-positive glia as detected by qRT-PCR on isolated radial glial cells (RGCs). Bars represent ± s.e.m. (B-F′) Gata3 and PCNA double immunostainings for dorsal regions of the adult zebrafish telencephalon. Insets in the panels are high-magnifications of representative cells without DAPI channel. (B-B′) Gata3 is initially seen at 12 hpl at the ventricular region (white arrows). Few cells co-label Gata3 and PCNA (yellow arrows). (C-C′) At 24 hpl, Gata3 cells are similar in location to 12 hpl and slightly more numerous. (D-D′) Gata3 cells are found in both proliferation zones (yellow arrows) and away from the ventricle at the adjacent neuronal layers (white arrows) at 3 dpl. (E-E′) The majority of the Gata3-positive cells are adjacent to the proliferating ventricular cells. (F-F′) Quantification graphs for Gata3-positive cells and their proliferation status in dorsomedial and dorsolateral regions of the lesioned hemisphere (See Suppl. Fig. 4 for unlesioned hemisphere). Scale bars 20 μm. Right sides of ventral and medial panels are injured hemispheres. n = 5 fish per time point, bars are ± s.e.m. (G) Scheme shows the regions analyzed. Graphs show the numbers of Gata3-positive cells in different regions of the lesioned and unlesioned hemispheres. Upper row shows the numbers of Gata3-PCNA double positive cells. Lower row shows the total number of Gata3-positive cells. Bars are ± s.e.m. Asterisks show comparisons to values from non-regenerating brains (left-most bars in each graph section). (H) Gata3 expression in the ventral telencephalon after the injury. (H1) GFP expression driven by the HuC/D promoter (huC:GFP) in the ventral telencephalon after the injury. (H2) BrdU-positive cells in the ventral telencephalon after the injury. (H3) Merge image of A-C. (I) Gata3 expression in the dorsal telencephalon after the injury. (I1) GFP expression driven by the HuC/D promoter in the dorsal telencephalon after the injury. (I2) BrdU-positive cells in the dorsal telencephalon after the injury. (I3) Merge image of E-G. Dashed lines demarcate the HuC/D expression boundaries. (J, K) BrdU-pulse is given 6 hours before the stab-lesion until 3 dpl continuously to label all cells that proliferate upon injury. Triple immunostainings for Gata3, huC:GFP, and BrdU are shown in high-magnification for dorsomedial and ventral regions of the telencephalon. In addition to BrdU-HuC double-positive cells (white arrows), Gata3 is also seen in HuC-positive cells that are BrdU-negative (yellow arrows). (L-O) Triple immunostainings for Gata3, L-Plastin (pan-leukocyte marker) and PCNA shown for dorsomedial (L), ventral (M) and dorsolateral telencephalon (N and O). (P) Quantification graph showing the percentage of total Gata3-positive cells in relation to colocalization with L-plastin and PCNA. A number of Gata3-positive cells scattered along the periventricular region are of myeloid origin as they express L-Plastin (yellow arrows), and a small portion of those are proliferating. Otherwise, Gata3-cells do not colocalize L-plastin (white arrows). The majority (94.2 ± 3.7 %) of Gata3-positive cells are L-Plastin-negative and thus are not the cells of the hematopoietic system. n = 5 fish, bars are ± s.e.m. (Q) In situ hybridization analyses of the expression patterns of the six gata factors – gata1 to gata6 - at 24 hpf of embryonic development. gata3 is mainly expressed in the otic placode. Other gata factors recapitulate their previously documented in situ expression patterns and show that the RNA probes are functional. (R) In situ hybridization analyses of the expression patterns of gata factors at 3 dpl of regenerating adult zebrafish telencephalon. Only gata3 is detected after the injury. (S) A BrdU-pulse at 3 dpl is followed by a 4-day lag-time. (T-X) Triple immunostainings on 7 dpl brain sections for Gata3 and BrdU with several markers are shown. Cells that are newborn at 3 dpl continue expressing Gata3 as they mature into Pax6- and Isl1-positive neurons (yellow arrows), Olig2-positive cells (yellow arrows), and differentiated neurons such as GABAergic neurons (yellow arrows), and dopaminergic neurons (yellow arrows). Gata3 expression persists in newborn neurons through neuronal differentiation of the telencephalon. Scale bars 10 ¼m. 18 sections from 3 fish were analyzed for each marker.
Reprinted from Developmental Cell, 23(6), Kizil, C., Kyritsis, N., Dudczig, S., Kroehne, V., Freudenreich, D., Kaslin, J., and Brand, M., Regenerative Neurogenesis from Neural Progenitor Cells Requires Injury-Induced Expression of Gata3, 1230-1237, Copyright (2012) with permission from Elsevier. Full text @ Dev. Cell