
|
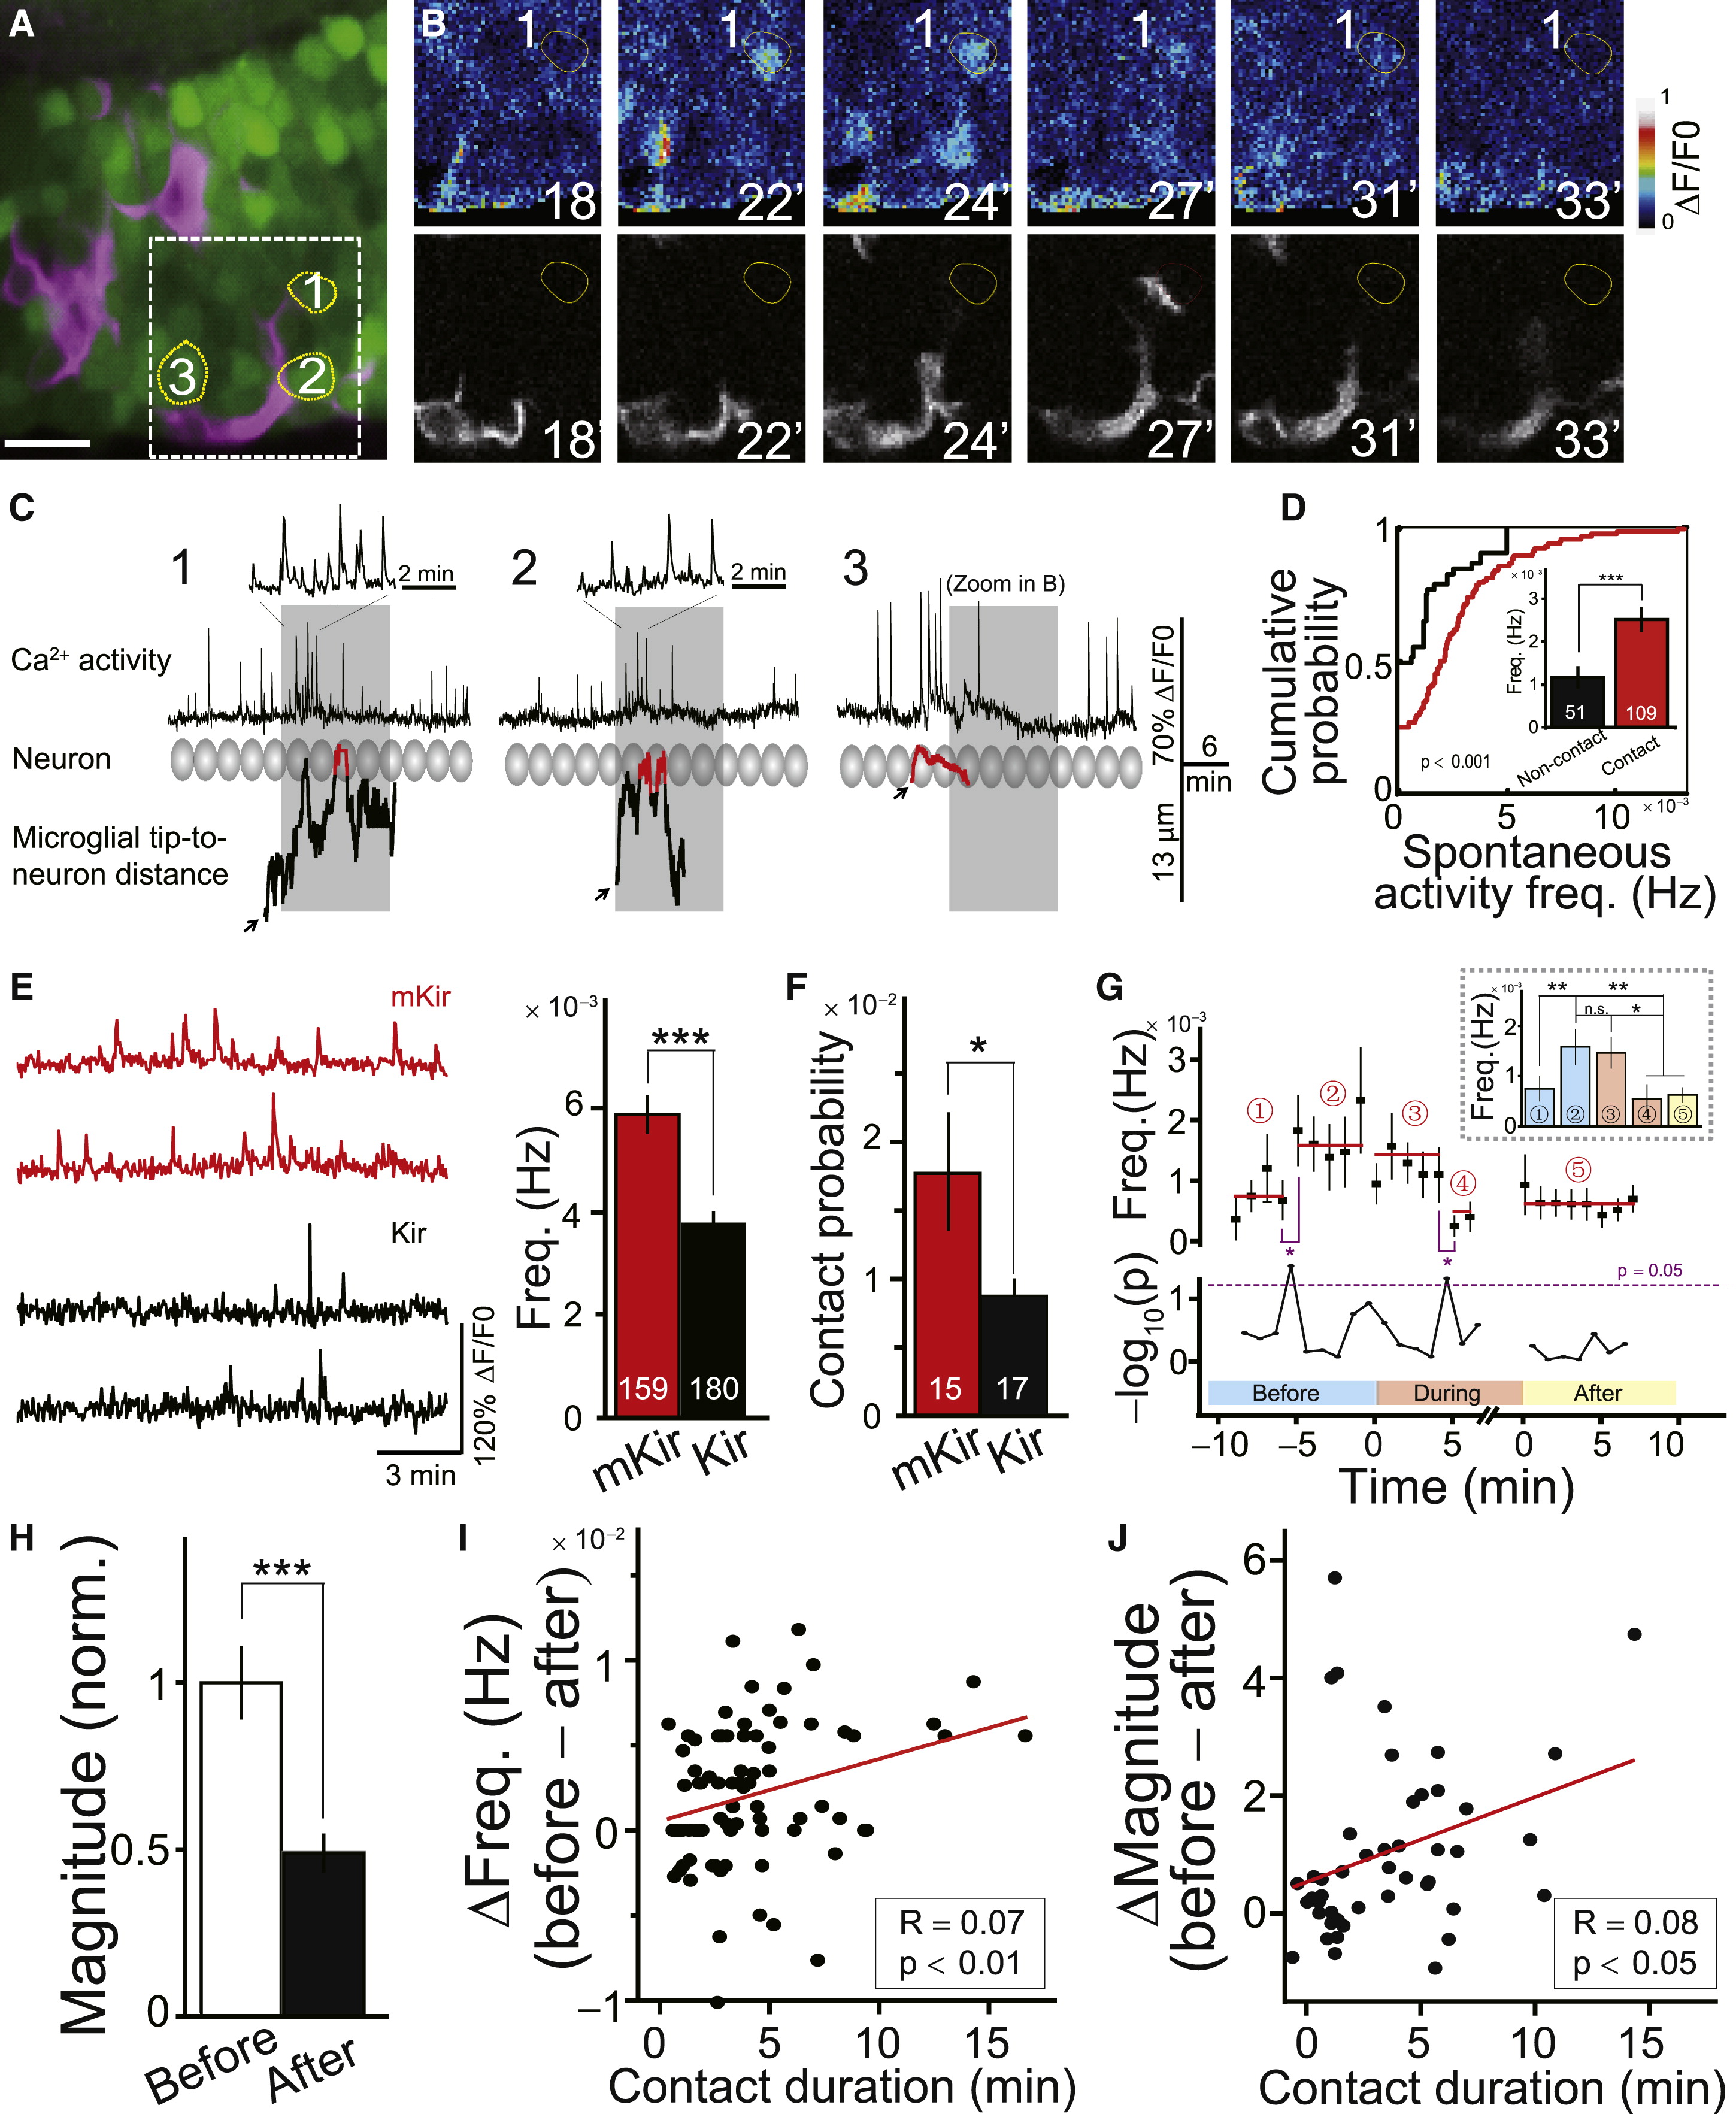
Fig. 5 Microglia Preferentially Contact Neurons with High Levels of Spontaneous Activity(A) Confocal image showing microglia (magenta) and neurons (green) loaded with OGB-AM in optic tectum. Numbered neurons exhibited high spontaneous Ca2+ activity and were contacted by microglial bulbous endings during experiment. Scale bar represents 5 μm.(B) Time-lapse images of the squared area shown in (A). Simultaneous imaging of neuronal activity (top) and microglial morphology (bottom). Occurrence of microglial contact with this neuron in red circle.(C) Temporal relationship between spontaneous Ca2+ activities (top) in the numbered neurons in (A) and (B) and occurrence of microglial contacts with those neurons (bottom). Shadowed ovals show position and size of the neurons. Traces (bottom) show dynamic changes in distance between neuron and corresponding microglial process tip. Red parts highlight occurrence of bulbous contact. Black arrows mark initiation point of processes from microglial primary branches or soma. Grey shadowed areas mark the period of images shown in (B).(D) Cumulative distribution of spontaneous Ca2+ activity frequency in microglia-contacted (Contact) and noncontacted neurons (Non-contact). Data obtained from 5 zebrafish larvae. Inset: averaged results. Number of neurons examined on bars.(E) Spontaneous Ca2+ activities in mKir- (red) and Kir- (black) expressing tectal neurons. Left: example traces. Right: summary of Ca2+ activity frequency.(F) Probability of contact between microglial processes and tectal neurons expressing mKir or Kir channels. Number of 6-dpf larvae examined on bars.(G) Time course of spontaneous Ca2+ activity frequency (top) and corresponding -log10(p value) (bottom) before (Periods 1 and 2), during (Periods 3 and 4), and after (Period 5) microglial contacts. Red lines represent average values for corresponding periods. Dashed line (bottom) indicates 0.05 of p value. Data obtained from 52 neurons contacted by seven microglia in five larvae. All data were aligned to time-points at which microglial contacts initiate and terminate. Inset: summary data.(H) Summary of total charge (Magnitude) of mean spontaneous Ca2+ transients within 6 min before and within 7 min after the microglial contact.(I and J) Correlation between decrease in the frequency (I) or magnitude (J) of spontaneous Ca2+ transients with duration of microglia-neuron contact. Red lines show linear regression fits (Spearman correlation analysis). n.s., no significance; p < 0.05; p < 0.01, p < 0.001. Spearman correlation analysis in (I) and (J). Error bars represent ± SEM.See also Figure S3.
Reprinted from Developmental Cell, 23(6), Li, Y., Du, X.F., Liu, C.S., Wen, Z.L., and Du, J.L., Reciprocal Regulation between Resting Microglial Dynamics and Neuronal Activity In Vivo, 1189-1202, Copyright (2012) with permission from Elsevier. Full text @ Dev. Cell