
|
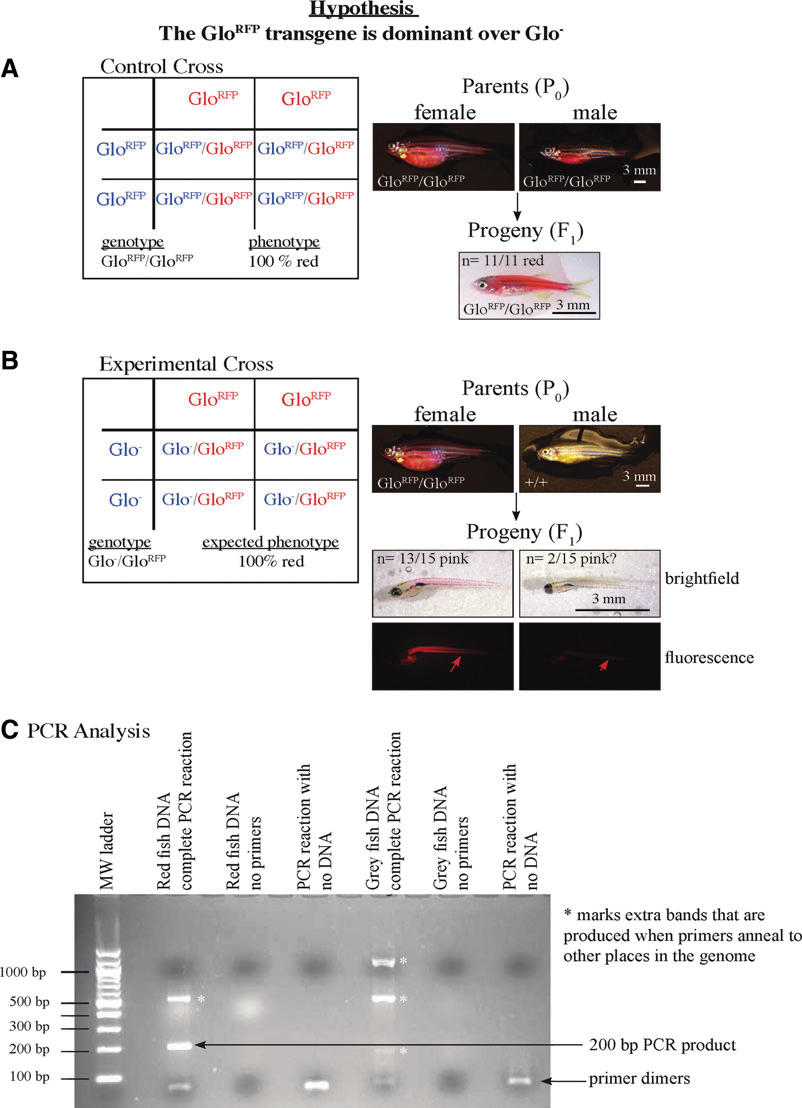
Fig. 1 (A) Punnett square and images outlining the expected and observed phenotypes and genotypes of the parents and progeny of the control cross. All fish in this cross were homozygous for GloRFP, and thus red whether the transgene was dominant or recessive. Thus, it served as a control to ensure that red body color could be effectively detected. (B) Punnett square and images of the expected and observed phenotypes of the cross testing the hypothesis that the red color and red fluorescence (arrows) are dominant over the gray/no fluorescence. If the hypothesis was correct, the students expected all of the progeny to have a red body color and to be red fluorescent. (C) Example gel showing products from PCR genotyping. The expected 200 bp band for the RFP gene is present only in the lane with red fish DNA and all of the components of a PCR reaction. Several of the lanes have a very small “primer dimer” product that was likely produced by the forward and reverse primers annealing to one other. In addition, some of the lanes show products that are not expected (*), suggesting that the annealing temperature was not high enough, and the primers were annealing to additional sites outside of the RFP gene. All images of fish are lateral views with anterior to the left.