
|
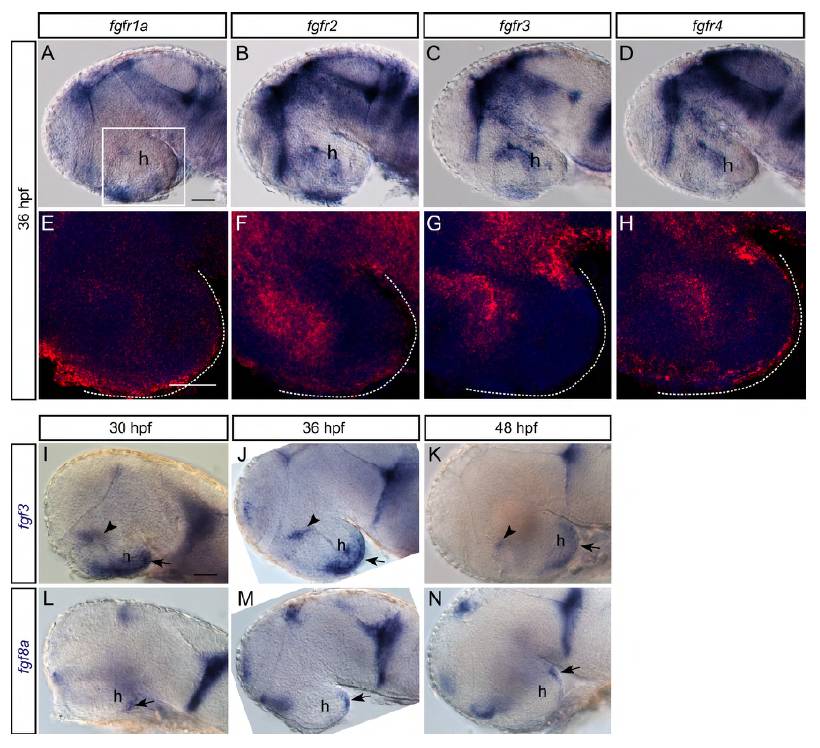
Fig. S6 Fgf receptors and ligands are expressed in the hypothalamus at a stage when 5-HT progenitors are proliferating. (A-D) fgfr1a, 2, 3 and 4 expression in whole-mount embryos. (E-H) Confocal maximum intensity projections of embryos processed for fluorescent ISH (red) and counterstained with DAPI (blue) covering 30 μm around the midline corresponding to boxed area in A. Transcripts for fgfr1a, 2 and 4, but not fgfr3, were detectable in the caudal hypothalamus (dashed line). (I-N) Expression of fgf3 and fgf8a in whole-mount embryos. At all stages analysed, both transcripts were detectable in the hypothalamus (h). However, fgf3 exhibited a broader expression domain covering the entire caudal/ventral hypothalamus (arrows) and a restricted part of the posterior tuberculum/hypothalamus (arrowheads) (I-K), whereas fgf8a was limited to an area in the most caudal/dorsal hypothalamus (arrows) (L-N). Lateral views, anterior left. Scale bars: 50 μm.