
|
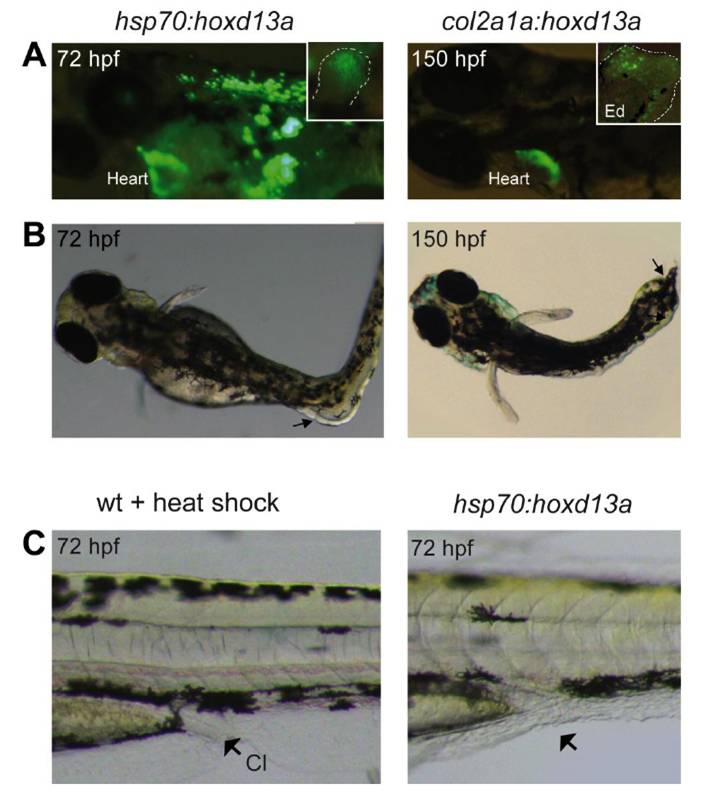
Fig. S2 Phenotypic alterations after hoxd13a overexpression promoted by hsp70 and col2a1a. Stages of development are indicated in upper left corner. A, Lateral view of hps70:hoxd13a (left) and col2a1a:hoxd13a (right) transgenic embryos showing green fluorescent protein (GFP) expression in the heart and distal fin region (delimited by dashed line in upper inserts). B, Dorsal view of hps70:hoxd13a (left) and col2a1a:hoxd13a (right) transgenic embryos showing trunk defects (arrows). C, Lateral view of the cloaca region (cl) showing opening defect in hsp70:hoxd13a transgenic embryos (compare arrow location in left and right panels).
Reprinted from Developmental Cell, 23(6), Freitas, R., Gómez-Marín, C., Wilson, J.M., Casares, F., and Gómez-Skarmeta, J.L., Hoxd13 contribution to the evolution of vertebrate appendages, 1219-1229, Copyright (2012) with permission from Elsevier. Full text @ Dev. Cell