
|
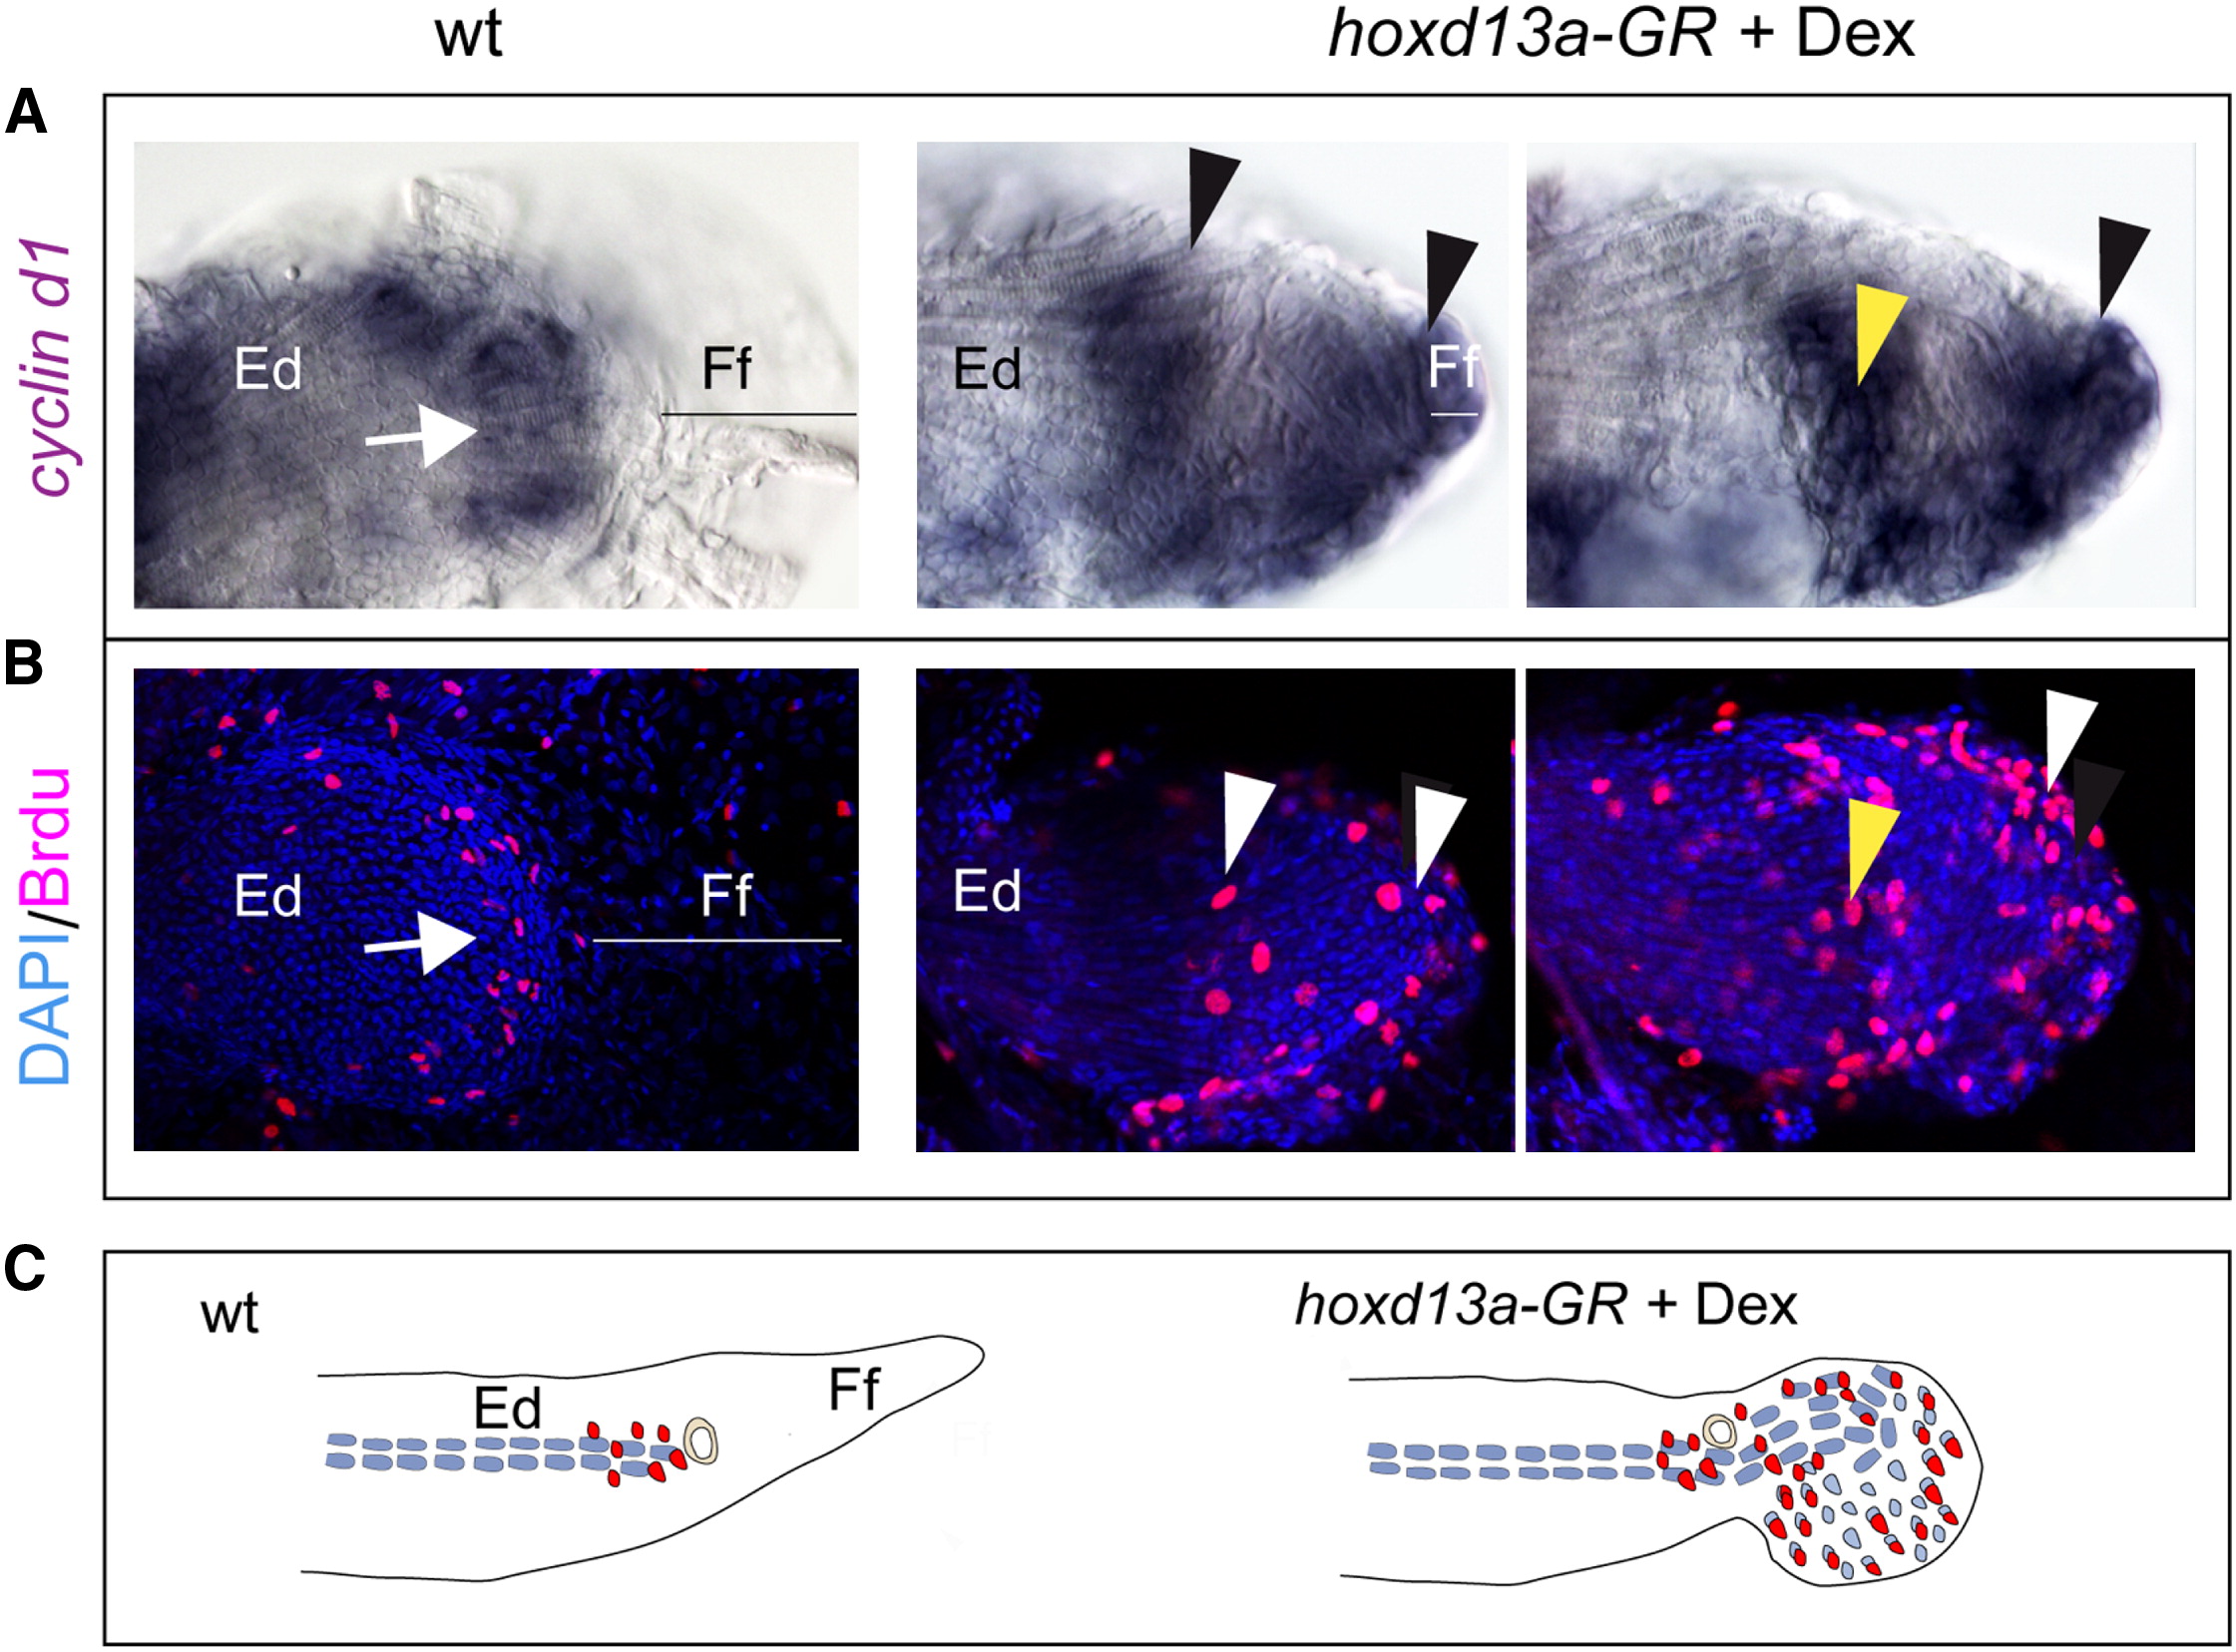
Fig. 4 hoxd13a Overexpression Cause Increased Proliferation Left column show wild-type controls (WT) and central and right columns show hoxd13a-overexpressing fins in two distinct dorsal/ventral planes. Ed, endoskeletal disc; Ff, finfold.(A) cyclin d1 expression is restricted to the distal end of the endoskeletal plate in WT (arrow). In hoxd13a-overexpressing fins, cyclin d1is observed throughout the expanded endoskeleton (arrowheads) and in the mass of cells folding from it (arrowheads).(B) Blue (DAPI) corresponds to cell nucleus and pink are proliferating cells (anti-BrdU). In WT fins, BrdU labeled cells are detected mainly at the distal end of the endoskeletal disc (arrow). Confocal planes throughout hoxd13a overexpressing fins show proliferation in the distal endoskeletal territory (white arrowheads) and in the mass of cells folding from it (arrowheads). Note similarities of the cyclin d1 expression and BrdU labeled cells distribution (yellow arrows mark equivalent domains).(C) Schematic representation summarizing cell proliferation levels in wild-type and hoxd13a-overexpressing fins. Chondrocytes are represented in blue and BrdU staining in red.
Reprinted from Developmental Cell, 23(6), Freitas, R., Gómez-Marín, C., Wilson, J.M., Casares, F., and Gómez-Skarmeta, J.L., Hoxd13 contribution to the evolution of vertebrate appendages, 1219-1229, Copyright (2012) with permission from Elsevier. Full text @ Dev. Cell